
MATLAB: An Introduction with Applications
6th Edition
ISBN: 9781119256830
Author: Amos Gilat
Publisher: John Wiley & Sons Inc
expand_more
expand_more
format_list_bulleted
Related questions
Question
I need help with this problem
![**Hypothesis Testing Guide: Proportion of Elementary School Districts Named Anderson**
**Hypothesis Statement:**
Test the hypothesis that the proportion of Elementary School Districts being Anderson has increased from 30%.
**Instructions:**
a) **Hypotheses Expression:**
- Express the null and alternative hypotheses in symbolic form for this claim.
- Enter your answer as a decimal. For example, if you have 35%, enter 0.35.
- Remember to enter a zero in front of the decimal point. However, if you have a percentage that is a multiple of 10, do not include the 0 after the number. For example, if you have 20%, enter 0.2, not 0.20.
- \( H_0: \) [Enter Text Box]
- \( H_a: \) [Enter Text Box]
**Parameters:**
- Proportion: enter \( p \)
- Mean: enter \( \mu \)
**Symbol Codes:**
- \( \ge \): enter >=
- \( \le \): enter <=
- \( \neq \): enter !=
b) **Test Statistic Calculation:**
- Find the test statistic. Round to two decimal places.
- [Enter Text Box]
c) **P-Value Calculation:**
- What is the p-value? Round to four decimals.
- \( p = \) [Enter Text Box]
d) **Decision Making:**
- Make a decision based on a 0.01 significance level.
- [ ] Do not reject the null
- [ ] Reject the null
e) **Conclusion:**
- What is the conclusion?
- [Enter Text Box]](https://content.bartleby.com/qna-images/question/ee710977-90c8-4f84-9cb1-1102aa3efb9b/e2e01ca6-0d5e-40b4-bb09-ed97caa10974/srzouo.jpeg)

Transcribed Image Text:**Hypothesis Testing Guide: Proportion of Elementary School Districts Named Anderson**
**Hypothesis Statement:**
Test the hypothesis that the proportion of Elementary School Districts being Anderson has increased from 30%.
**Instructions:**
a) **Hypotheses Expression:**
- Express the null and alternative hypotheses in symbolic form for this claim.
- Enter your answer as a decimal. For example, if you have 35%, enter 0.35.
- Remember to enter a zero in front of the decimal point. However, if you have a percentage that is a multiple of 10, do not include the 0 after the number. For example, if you have 20%, enter 0.2, not 0.20.
- \( H_0: \) [Enter Text Box]
- \( H_a: \) [Enter Text Box]
**Parameters:**
- Proportion: enter \( p \)
- Mean: enter \( \mu \)
**Symbol Codes:**
- \( \ge \): enter >=
- \( \le \): enter <=
- \( \neq \): enter !=
b) **Test Statistic Calculation:**
- Find the test statistic. Round to two decimal places.
- [Enter Text Box]
c) **P-Value Calculation:**
- What is the p-value? Round to four decimals.
- \( p = \) [Enter Text Box]
d) **Decision Making:**
- Make a decision based on a 0.01 significance level.
- [ ] Do not reject the null
- [ ] Reject the null
e) **Conclusion:**
- What is the conclusion?
- [Enter Text Box]
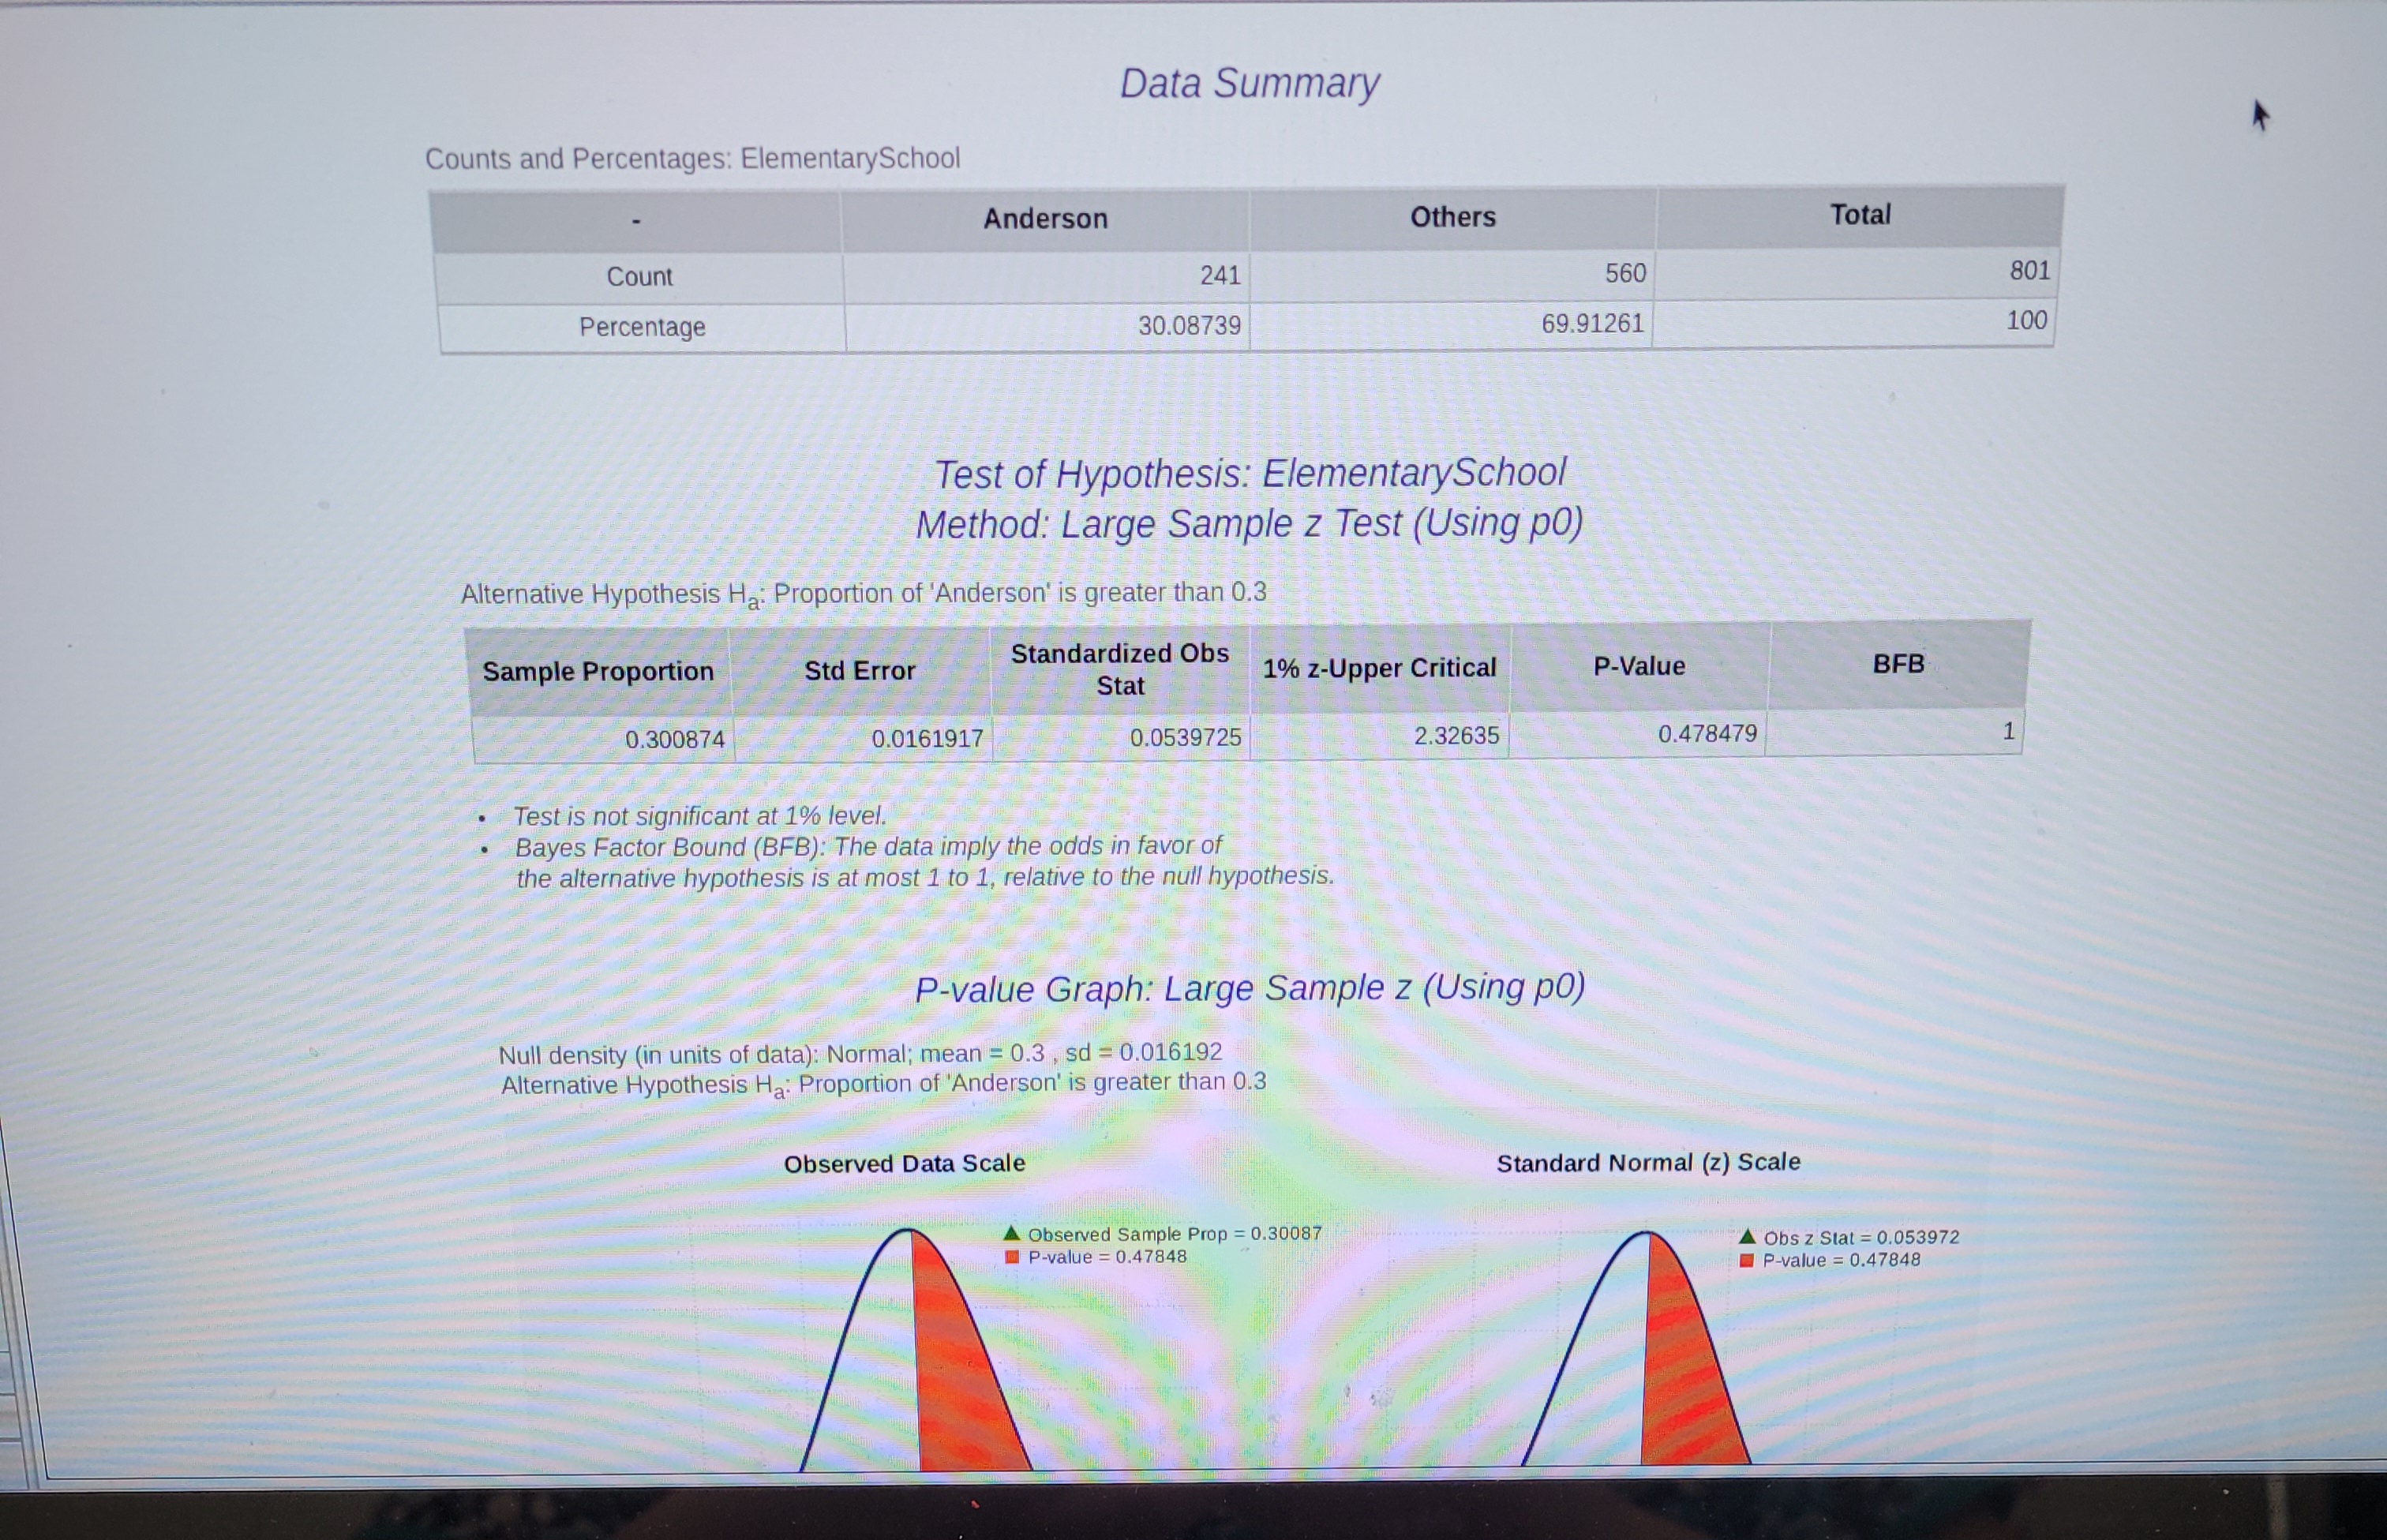
Transcribed Image Text:**Data Summary**
Counts and Percentages: Elementary School
| | Anderson | Others | Total |
|----------------|----------|--------|-------|
| Count | 241 | 560 | 801 |
| Percentage | 30.08739 | 69.91261 | 100 |
---
**Test of Hypothesis: Elementary School**
*Method: Large Sample z Test (Using p0)*
*Alternative Hypothesis \(H_a\): Proportion of 'Anderson' is greater than 0.3*
| Sample Proportion | Std Error | Standardized Obs Stat | 1% z-Upper Critical | P-Value | BFB |
|-------------------|-----------|-----------------------|---------------------|----------|------|
| 0.300874 | 0.0161917 | 0.0539725 | 2.32635 | 0.478479 | 1 |
- Test is not significant at 1% level.
- Bayes Factor Bound (BFB): The data imply the odds in favor of the alternative hypothesis is at most 1 to 1, relative to the null hypothesis.
---
**P-value Graph: Large Sample z (Using p0)**
- *Null density (in units of data): Normal; mean = 0.3, sd = 0.0161917.*
- *Alternative Hypothesis \(H_a\): Proportion of 'Anderson' is greater than 0.3.*
Graph Explanation:
- **Observed Data Scale**: The graph shows the distribution of the observed data with an emphasized area (in red) representing the observed sample proportion (0.30087) and the p-value (0.47848).
- **Standard Normal (z) Scale**: The graph presents the distribution on a standard normal scale, with the observed z statistic (0.053972) and the corresponding p-value (0.47848) highlighted.
The graphs visually compare the observed data and the standard normal distribution, illustrating the hypothesis testing results.
Expert Solution
This question has been solved!
Explore an expertly crafted, step-by-step solution for a thorough understanding of key concepts.

This is a popular solution

Trending nowThis is a popular solution!

Step by stepSolved in 6 steps

Knowledge Booster

Similar questions
arrow_back_ios
arrow_forward_ios
Recommended textbooks for you
- MATLAB: An Introduction with ApplicationsStatisticsISBN:9781119256830Author:Amos GilatPublisher:John Wiley & Sons Inc
 Probability and Statistics for Engineering and th...StatisticsISBN:9781305251809Author:Jay L. DevorePublisher:Cengage Learning
 Statistics for The Behavioral Sciences (MindTap C...StatisticsISBN:9781305504912Author:Frederick J Gravetter, Larry B. WallnauPublisher:Cengage Learning
  Elementary Statistics: Picturing the World (7th E...StatisticsISBN:9780134683416Author:Ron Larson, Betsy FarberPublisher:PEARSON
 The Basic Practice of StatisticsStatisticsISBN:9781319042578Author:David S. Moore, William I. Notz, Michael A. FlignerPublisher:W. H. Freeman
 Introduction to the Practice of StatisticsStatisticsISBN:9781319013387Author:David S. Moore, George P. McCabe, Bruce A. CraigPublisher:W. H. Freeman
MATLAB: An Introduction with Applications
Statistics
ISBN:9781119256830
Author:Amos Gilat
Publisher:John Wiley & Sons Inc
Probability and Statistics for Engineering and th...
Statistics
ISBN:9781305251809
Author:Jay L. Devore
Publisher:Cengage Learning
Statistics for The Behavioral Sciences (MindTap C...
Statistics
ISBN:9781305504912
Author:Frederick J Gravetter, Larry B. Wallnau
Publisher:Cengage Learning
Elementary Statistics: Picturing the World (7th E...
Statistics
ISBN:9780134683416
Author:Ron Larson, Betsy Farber
Publisher:PEARSON
The Basic Practice of Statistics
Statistics
ISBN:9781319042578
Author:David S. Moore, William I. Notz, Michael A. Fligner
Publisher:W. H. Freeman
Introduction to the Practice of Statistics
Statistics
ISBN:9781319013387
Author:David S. Moore, George P. McCabe, Bruce A. Craig
Publisher:W. H. Freeman