
MATLAB: An Introduction with Applications
6th Edition
ISBN: 9781119256830
Author: Amos Gilat
Publisher: John Wiley & Sons Inc
expand_more
expand_more
format_list_bulleted
Related questions
Question
A.) p value
B.) reject or keep
C.) state conclusion
The General Social Survey conducted a poll of adults in which the subjects were asked whether they agree that the government should prohibit smoking in public places. In addition, each was asked how many people lived in his or her household. The results are summarized in the following contingency table .
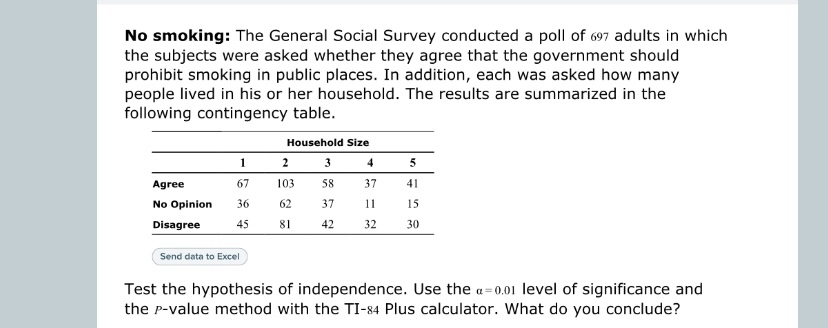

Transcribed Image Text:No smoking: The General Social Survey conducted a poll of 697 adults in which
the subjects were asked whether they agree that the government should
prohibit smoking in public places. In addition, each was asked how many
people lived in his or her household. The results are summarized in the
following contingency table.
Agree
No Opinion
Disagree
1
67
36
45
Send data to Excel
Household Size
3
58
37
42
2
103
62
81
37
11
32
5
41
15
30
Test the hypothesis of independence. Use the a=0.01 level of significance and
the p-value method with the TI-84 Plus calculator. What do you conclude?
Expert Solution
This question has been solved!
Explore an expertly crafted, step-by-step solution for a thorough understanding of key concepts.

This is a popular solution

Trending nowThis is a popular solution!

Step by stepSolved in 3 steps with 10 images

Knowledge Booster

Similar questions
- Develop three categorical questions for the survey.c. Develop three numerical questions for the survey.arrow_forwardAlex believes the honor roll students at his school have an unfair advantage in being assigned to the science class they request. He asked 500 students at his school the following questions: "Are you on the honor roll?" and "Did you get the science class you requested?" The results are shown in the table below: Help Alex determine if all students at his school have an equal opportunity to get into the science class they requested. Show your work, and explain your process for determining the fairness of the class assignment process.arrow_forwardThe table below shows the number of survey subjects who have received and not received a speeding ticket in the last year, and the color of their cars. d) Has a red car given they have a speeding ticket. ?e) Has a red car and got a speeding ticket. ?f) Has a red car or got a speeding ticket. ?Write your answers in decimal form, rounded to the nearest thousandth.arrow_forward
- Surveys were conducted with every 7 households in Muscogee County, asking individuals to report information on their household, such as age, sex, race, education, income levels, and current health care needs. The purpose of the study was to describe the population of Muscogee County and assess the current health care needs of its constituents. 3. What research design was likely used to conduct this research? a. Case report b. Case series c. Ecological Study d. Cross-sectional (descriptive) e. Cross-sectional (analytic) f. Case-control study g. Retrospective cohort study h. Prospective cohort study i. Randomized clinical trialarrow_forwardI am struggling with part B of this question.arrow_forwardSuppose you have a data set that includes the values 20,30, and 50. If you add a fourth value to this data set, and after doing that the mean of the data set is 50, what was the value that you added? a) 20 b) 40 c) 50 d) 100arrow_forward
- Each accountant at a large accounting firm was classified according to accountant level (junior or senior) and method of transportation to work (walk, bus, drive alone, or carpool). The responses of the 320 accountants at the firm are summarized in the table. Junior Senior Total Walk 25 3 28 Bus 87 12 99 Drive alone 96 25 121 Carpool 52 20 72 Total 260 60 320 What proportion of the accountants at the firm are at the senior level and carpool to work? 20 (A) 60 20 (B) 72 (C) 20 320 112 (D) 320 132 (E) 320arrow_forwardI need help with question #2, part d-earrow_forwardThere’s two part to this question. It has parts A-E.arrow_forward
- a. Use the Colley method to come up with a rating for each team, then rank them. b. What were some of the strengths and weaknesses of this method?arrow_forwardA) What percentage of children who were surveyed said that they preferred cars? Group of answer choices 37% 11% 36% 24% 16% 52% B)What proportion of children ages 1-3 who were surveyed said that they preferred blocks? .0010 .049 .105 240 .360 c)hat proportion of those who preferred cars were in the 1-3 age group? 0.16 0.29 0.57 0.28 0.19 0.14 0.36arrow_forwardUSE THE FOLLOWING INFORMATION TO ANSWER THE NEXT TWO QUESTIONS. At a particular university, 60 % of the students who apply for admission are in-state residents, 30 % are from other states, and the remaining applicants are international students. 35 % of in-state applicants are admitted, 25 % of applicants from other states are admitted, and 20 % of international applicants are admitted. 13) What percent of applicants are admitted?arrow_forward
arrow_back_ios
SEE MORE QUESTIONS
arrow_forward_ios
Recommended textbooks for you
- MATLAB: An Introduction with ApplicationsStatisticsISBN:9781119256830Author:Amos GilatPublisher:John Wiley & Sons Inc
 Probability and Statistics for Engineering and th...StatisticsISBN:9781305251809Author:Jay L. DevorePublisher:Cengage Learning
 Statistics for The Behavioral Sciences (MindTap C...StatisticsISBN:9781305504912Author:Frederick J Gravetter, Larry B. WallnauPublisher:Cengage Learning
  Elementary Statistics: Picturing the World (7th E...StatisticsISBN:9780134683416Author:Ron Larson, Betsy FarberPublisher:PEARSON
 The Basic Practice of StatisticsStatisticsISBN:9781319042578Author:David S. Moore, William I. Notz, Michael A. FlignerPublisher:W. H. Freeman
 Introduction to the Practice of StatisticsStatisticsISBN:9781319013387Author:David S. Moore, George P. McCabe, Bruce A. CraigPublisher:W. H. Freeman
MATLAB: An Introduction with Applications
Statistics
ISBN:9781119256830
Author:Amos Gilat
Publisher:John Wiley & Sons Inc
Probability and Statistics for Engineering and th...
Statistics
ISBN:9781305251809
Author:Jay L. Devore
Publisher:Cengage Learning
Statistics for The Behavioral Sciences (MindTap C...
Statistics
ISBN:9781305504912
Author:Frederick J Gravetter, Larry B. Wallnau
Publisher:Cengage Learning
Elementary Statistics: Picturing the World (7th E...
Statistics
ISBN:9780134683416
Author:Ron Larson, Betsy Farber
Publisher:PEARSON
The Basic Practice of Statistics
Statistics
ISBN:9781319042578
Author:David S. Moore, William I. Notz, Michael A. Fligner
Publisher:W. H. Freeman
Introduction to the Practice of Statistics
Statistics
ISBN:9781319013387
Author:David S. Moore, George P. McCabe, Bruce A. Craig
Publisher:W. H. Freeman