
Glencoe Algebra 1, Student Edition, 9780079039897, 0079039898, 2018
18th Edition
ISBN: 9780079039897
Author: Carter
Publisher: McGraw Hill
expand_more
expand_more
format_list_bulleted
Related questions
Question
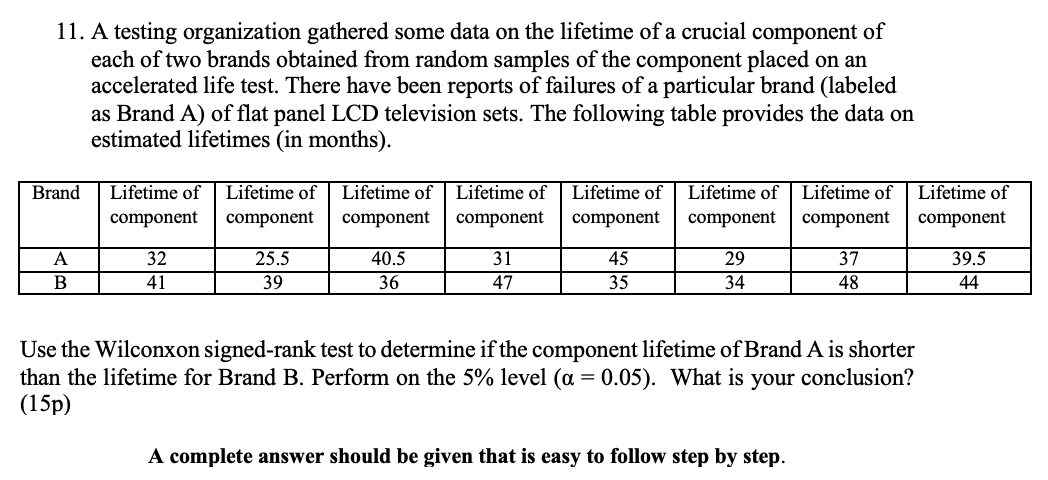

Transcribed Image Text:11. A testing organization gathered some data on the lifetime of a crucial component of
each of two brands obtained from random samples of the component placed on an
accelerated life test. There have been reports of failures of a particular brand (labeled
as Brand A) of flat panel LCD television sets. The following table provides the data on
estimated lifetimes (in months).
Brand
A
B
Lifetime of Lifetime of
component
component
32
41
25.5
39
Lifetime of
component
40.5
36
Lifetime of
component
31
47
Lifetime of
component
45
35
Lifetime of
component
29
34
Lifetime of
component
A complete answer should be given that is easy to follow step by step.
37
48
Use the Wilconxon signed-rank test to determine if the component lifetime of Brand A is shorter
than the lifetime for Brand B. Perform on the 5% level (a = 0.05). What is
(15p)
your conclusion?
Lifetime of
component
39.5
44
Expert Solution
This question has been solved!
Explore an expertly crafted, step-by-step solution for a thorough understanding of key concepts.

Step by stepSolved in 3 steps with 1 images

Follow-up Questions
Read through expert solutions to related follow-up questions below.
Follow-up Question
Test statistic = min {R1, R2} = 6.5
Critical value = 6 (from table)
Since the test statistic is less than the critical value, we reject the null hypothesis.
What do you mean that we are rejecting the null hypothesis? 6,5>6? Thank you in advance!
Solution
by Bartleby Expert
Knowledge Booster

Similar questions
- Studies of the size and range of wild animal populations often involve tagging observed individual animals and recording how many times each is caught in a trap (from which it is then released back into the wild). The dataset presented in Table 3 consists of the numbers of times each of n = 334 wood mice were caught in a particular trap (over a two-year time period). The data are also provided in the Minitab file wood-mice.mwx. Table 3 Numbers of trappings of wood mice Times trapped 1 2 Frequency 3 4 5 6 7 8 9 71 59 41 39 20 26 19 12 9 Times trapped 10 11 12 13 14 Frequency 5 15 16 17 18 8 49 2 13 3 3 The geometric distribution with parameter p is a good model for these data. (i) What is the maximum likelihood estimator of p for a geometric model? (ii) What is the maximum likelihood estimate of p for the data in Table 3? You are recommended to use Minitab to help you to answer this part of the question.arrow_forwardThe 5-year incidence of cardiovascular disease (CVD) in relation to smoking status was determined in a population sample of 1000 men, 18 years and older. At baseline, 30% of the men were classified as being current smokers and 70% as being non-smokers. At the end of the follow-up, 60 CVD events had occurred among the smokers and 70 events among the non-smokers. Construct a 2 x 2 table based on the data providedarrow_forwardReduced heart rate variability (HRV) is known to be a predictor of mortality after a heart attack. One measure of HRV is the average normal-to-normal beat interval (in milliseconds) for a 24-hr time period. Twenty-two heart attack patients who were dog owners and 80 heart attack patients who did not own a dog participated in a study of the effect of pet ownership on HRV, resulting in the summary statistics shown in the accompanying table.arrow_forward
- Reduced heart rate variability (HRV) is known to be a predictor of mortality after a heart attack. One measure of HRV is the average normal-to-normal beat interval (in milliseconds) for a 24-hr time period. Twenty-two heart attack patients who were dog owners and 80 heart attack patients who did not own a dog participated in a study of the effect of pet ownership on HRV, resulting in the summary statistics shown in the accompanying table. The authors of this paper used a two-sample t test to test H0: ?1 − ?2 = 0 versus Ha: ?1 − ?2 ≠ 0. What conditions must be met in order for this to be an appropriate method of analysis? (Select all that apply.) Find the test statistic and P-value.arrow_forwardReduced heart rate variability (HRV) is known to be a predictor of mortality after a heart attack. One measure of HRV is the average normal-to-normal beat interval (in milliseconds) for a 24-hr time period. Twenty-two heart attack patients who were dog owners and 80 heart attack patients who did not own a dog participated in a study of the effect of pet ownership on HRV, resulting in the summary statistics shown in the accompanying table. Measure of HRV(Average Normal-to-Normal Beat Interval) Mean StandardDeviation Owns Dog 871 134 Does Not Own Dog 800 138 (b) The paper indicates that the null hypothesis in part (a) was rejected and reported that the P-value was less than 0.05. Carry out a two-sample t test. (Use ? = 0.05. Use ?1 for heart attack patients who are dog owners and ?2 for heart attack patients who do not own a dog.) Find the test statistic and P-value. (Use SALT. Round your test statistic to one decimal place and your P-value to three decimal places.) t=…arrow_forwardOn each trial of an experiment, a participant is presented with a constant soft noise, which is interrupted at some unpredictable time by a slightly louder sound. The time it takes for the participant to react to the louder sound is recorded. The following list contains the reaction times (in milliseconds) for 7 trials of this experiment. 541, 800, 667, 362, 542, 667, 800 Send data to calculator (a) What is the median of this data set? If your answer is not an integer, round your answer to one decimal place. 1 2 (b) What is the mean of this data set? If your answer is not an integer, round your answer to one decimal place. (c) How many modes does the data set have, and what are their values? Indicate the number of modes by clicking in the appropriate circle, and then indicate the value(s) of the mode(s), if applicable. zero modes one mode: 0 O two modes: and ?arrow_forward
- Anemia (low healthy blood cells or hemoglobin) has an important role in exercise performance. However, the direct link between rapid changes of hemoglobin and exercise performance is still unknown. A study investigated 18 patients with a blood disorder (beta-thalassemia). Participants in the study performed an exercise test before and the day after receiving a blood transfusion. Data are given in the table. HB = Hemoglobin RER = Respiratory exchange ID Change in HB Obese RER > 1.1 ratio No No 1 -1.4 No -1.5 No Yes No Yes 3 -2 No 4 -2.1 No -1.9 Yes Yes No -1.6 -1.8 -0.8 6 7 No Yes No Yes 8 9. -1 No No -1.2 No Yes 10 11 No No -0.8 -1.5 12 Yes No No Yes 13 14 -1.4 -2.6 -1.7 No No Yes Yes 15 Yes No Yes Yes 16 -2.6 No 17 18 -2.7 -1.5 Noarrow_forwardBlood cocaine concentration (mg/L) was determinedboth for a sample of individuals who had died fromcocaine-induced excited delirium (ED) and for a sampleof those who had died from a cocaine overdose withoutexcited delirium; survival time for people in bothgroups was at most 6 hours. The accompanying datawas read from a comparative boxplot in the article“Fatal Excited Delirium Following Cocaine Use” (J.of Forensic Sciences, 1997: 25–31). ED 0 0 0 0 .1 .1 .1 .1 .2 .2 .3 .3.3 .4 .5 .7 .8 1.0 1.5 2.7 2.83.5 4.0 8.9 9.2 11.7 21.0Non-ED 0 0 0 0 0 .1 .1 .1 .1 .2 .2 .2.3 .3 .3 .4 .5 .5 .6 .8 .9 1.01.2 1.4 1.5 1.7 2.0 3.2 3.5 4.14.3 4.8 5.0 5.6 5.9 6.0 6.4 7.98.3 8.7 9.1 9.6 9.9 11.0 11.512.2 12.7 14.0 16.6 17.8 a. Determine the medians, fourths, and fourth spreadsfor the two samples.b. Are there any outliers in either sample? Any extremeoutliers?c. Construct a comparative boxplot, and use it as abasis for comparing and contrasting the ED andnon-ED samples.arrow_forwardThe table gives the first 5 observations of 4242 years of data on boats registered in Florida and manatees killed by boats. Year Boats Manatees 1977 447 13 1978 460 21 1979 481 24 1980 498 16 1981 513 24 1982 512 20 Click to download the data in your preferred format to view the full data. CSV Excel JMP Mac-Text Minitab14-18 Minitab18+ PC-Text R SPSS TI CrunchIt! The scatterplot of this data shows a strong positive linear relationship. The correlation is ?=0.919. (b) Suppose we expect that the number of boats registered in Florida to be 950,000 in 2019. What would you predict the number of manatees killed by boats to be if there are 950,000 boats registered? Give your answer to a whole number. ?̂ = manatee deaths Select the statements that explain why we can trust this prediction. The prediction is reliable because of the strong linear association visible in the scatterplot. The…arrow_forward
- A cell phone manufacturer tests the battery lifetimes of its cell phones by recording the time it takes for the battery charges to run out while testers are playing games on the phones continuously. The manufacturer claims that the population mean of the battery lifetimes of all phones of their latest model is 5.64 hours. As a researcher for a consumer information service, you want to test that claim. To do so, you select a random sample of 45 cell phones of the manufacturer's latest model and record their battery lifetimes. Assume it is known that the population standard deviation of the battery lifetimes for that cell phone model is 2.73 hours. Based on your sample, follow the steps below to construct a 90% confidence interval for the population mean of the battery lifetimes for all phones of the manufacturer's latest model. Then state whether the confidence interval you construct contradicts the manufacturer's claim. (If necessary, consult a list of formulas.) (a) Click on "Take…arrow_forwardA cell phone manufacturer tests the battery lifetimes of its cell phones by recording the time it takes for the battery charges to run out while testers are playing games on the phones continuously. The manufacturer claims that the population mean of the battery lifetimes of all phones of their latest model is 5.28 hours. As a researcher for a consumer information service, you want to test that claim. To do so, you select a random sample of 45 cell phones of the manufacturer's latest model and record their battery lifetimes. Assume it is known that the population standard deviation of the battery lifetimes for that cell phone model is 2.73 hours. Based on your sample, follow the steps below to construct a 90% confidence interval for the population mean of the battery lifetimes for all phones of the manufacturer's latest model. Then state whether the confidence interval you construct contradicts the manufacturer's claim. (If necessary, consult a list of formulas.) (a) Click on "Take…arrow_forwardOld Faithful is a geyser located in Yellowstone National Park in Wyoming, USA. Millions of travelers come from afar to witness Old Faithful's eruptions each year. Travelers to Yellowstone are told that Old Faithful is expected to erupt, on average, every 7272 minutes, but park scientists suspect that this average is incorrect. To investigate, the scientists determine the waiting time until the next eruption for a random sample of 272272 Old Faithful eruptions. The waiting times have a mean of 70.897 minutes and a standard deviation of 13.595 minutes. You will use these data to carry out a significance test at the ?α = 0.05 level.arrow_forward
arrow_back_ios
SEE MORE QUESTIONS
arrow_forward_ios
Recommended textbooks for you
- Glencoe Algebra 1, Student Edition, 9780079039897...AlgebraISBN:9780079039897Author:CarterPublisher:McGraw Hill
 Big Ideas Math A Bridge To Success Algebra 1: Stu...AlgebraISBN:9781680331141Author:HOUGHTON MIFFLIN HARCOURTPublisher:Houghton Mifflin Harcourt
 Holt Mcdougal Larson Pre-algebra: Student Edition...AlgebraISBN:9780547587776Author:HOLT MCDOUGALPublisher:HOLT MCDOUGAL
  Linear Algebra: A Modern IntroductionAlgebraISBN:9781285463247Author:David PoolePublisher:Cengage Learning
Glencoe Algebra 1, Student Edition, 9780079039897...
Algebra
ISBN:9780079039897
Author:Carter
Publisher:McGraw Hill
Big Ideas Math A Bridge To Success Algebra 1: Stu...
Algebra
ISBN:9781680331141
Author:HOUGHTON MIFFLIN HARCOURT
Publisher:Houghton Mifflin Harcourt
Holt Mcdougal Larson Pre-algebra: Student Edition...
Algebra
ISBN:9780547587776
Author:HOLT MCDOUGAL
Publisher:HOLT MCDOUGAL
Linear Algebra: A Modern Introduction
Algebra
ISBN:9781285463247
Author:David Poole
Publisher:Cengage Learning