
MATLAB: An Introduction with Applications
6th Edition
ISBN: 9781119256830
Author: Amos Gilat
Publisher: John Wiley & Sons Inc
expand_more
expand_more
format_list_bulleted
Related questions
Question
QUESTION 2
Possible Lessons:
Spearman’s Rank-Order Correlation
Introduction to Hypothesis Testing
Steps of Hypothesis Testing
Appropriate Statistical Test
The t-test and Z-test
Question:
The following data show the percentage of the votes predicted by poll survey (x) for 8 candidates for the senate in different provinces and the percentage of the votes they actually received (y). Test at 5% level of significance if relationship exist between poll survey and actual votes received.
Data is attached below.
Please show complete and accurate solution. Kindly make the solution clear and readable.
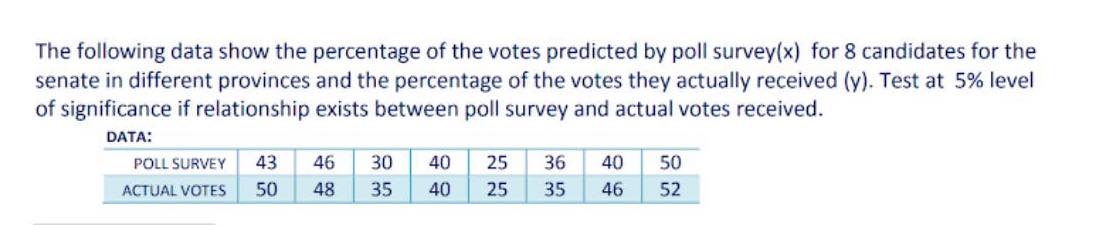

Transcribed Image Text:The following data show the percentage of the votes predicted by poll survey(x) for 8 candidates for the
senate in different provinces and the percentage of the votes they actually received (y). Test at 5% level
of significance if relationship exists between poll survey and actual votes received.
DATA:
POLL SURVEY 43 46 30
ACTUAL VOTES 50 48 35
40
25
40 25
36 40 50
35
46 52
Expert Solution
This question has been solved!
Explore an expertly crafted, step-by-step solution for a thorough understanding of key concepts.

Step by stepSolved in 3 steps with 1 images

Knowledge Booster

Similar questions
- An I/O psychologist wants to know if there is a difference in worker evaluations depending if the evaluator is a male or female. 15 men and 15 women managers were asked to rate on a scale of 0-10 the same group of worker files. The ratings on the worker evaluations were recorded for each manager. Which statistical test would be best to determine if there is a significant difference between groups? one-sample t-test dependent samples t-test independent samples t-test ANOVAarrow_forwardpare percentage differences between 2 or more categories of an independent variable), the following statistical test should be used: a. Simple linear regression b. Pearson correlation coefficient c. T test d. Chi-square testarrow_forwardResearchers were interested in assessing whether stress levels are different at the beginning of the semester compared to finals week. To test this, stress was measured in 5 students at the start of the semester and then again at the end of the semester during finals week. Participant Stress 1 Stress 2 Difference Score (Di) (Di - Mdiff)2 1 22 22 0 2 32 34 -2 3 24 25 -1 4 28 30 -2 5 26 29 -3 What is the observed test statistic (i.e., tobs)? Round to 2 decimal places.arrow_forward
- A brokerage firm wants to conduct a study to see if there is a linear relationship between the size of an account and the number of trades conducted each year. What would be the most appropriate procedure to use to analyze data to answer this question? Only choose a test that handles multiple comparisons if such a test is needed. O ANOVA (Analysis of Variance) O Regression Test of Slope or Correlation O Test for a Difference of Proportions O Chi-square test of association O Test for a Difference of Meansarrow_forward-What does it mean if two samples are significantly different from each other? What does it mean if they are not significantly different? -Economists say women make less than men in the United States by a wide margin. Do we find the same thing? What about income differences between White and Black Americans in the U.S.? How does our data fit with our understanding of pay discrepancies? in reference to t tests use graph to answer questoinsarrow_forwardAdverse reactions of a drug used to help patients continue their abstinence from the use of alcohol have been studied in clinical trials, and the accompanying table summarizes results for digestive system effects among patients from different treatment groups. Use a 0.05 significance level to test the claim that experiencing an adverse reaction in the digestive system is independent of the treatment group. Does the drug treatment appear to have an effect on the digestive system? Click the icon to view the data on adverse reactions from treatments. Determine the null and alternative hypotheses. OA. Ho: Drug treatment and adverse effects are not independent. H₁: Drug treatment and adverse effects are independent. OB. Ho: The drug treatment results in adverse effects on the digestive system. H₁: The drug treatment does not result in adverse effects on the digestive system. OC. Ho: Drug treatment and adverse effects are independent. H₁: Drug treatment and adverse effects are not…arrow_forward
- Is there a relationship between one’s gender and whether one owns a dog, cat, or reptile? Use the data provided in the table below to answer the following question. -Show all the relevant statistical output How do I enter this data in SPSS and which test do I run? I input one column for each level but I am so confused and my output is weird looking. Do I run the One Way ANOVA in order to be able to calculate the effect size? Dog Cat Reptile Row Totals Male 20 17 11 48 Female 25 23 5 53 Column totals 45 40 16 101arrow_forwardOne advantage of a within subjects ANOVA is that the participants serve as their own comparisons true or false?arrow_forward
arrow_back_ios
arrow_forward_ios
Recommended textbooks for you
- MATLAB: An Introduction with ApplicationsStatisticsISBN:9781119256830Author:Amos GilatPublisher:John Wiley & Sons Inc
 Probability and Statistics for Engineering and th...StatisticsISBN:9781305251809Author:Jay L. DevorePublisher:Cengage Learning
 Statistics for The Behavioral Sciences (MindTap C...StatisticsISBN:9781305504912Author:Frederick J Gravetter, Larry B. WallnauPublisher:Cengage Learning
  Elementary Statistics: Picturing the World (7th E...StatisticsISBN:9780134683416Author:Ron Larson, Betsy FarberPublisher:PEARSON
 The Basic Practice of StatisticsStatisticsISBN:9781319042578Author:David S. Moore, William I. Notz, Michael A. FlignerPublisher:W. H. Freeman
 Introduction to the Practice of StatisticsStatisticsISBN:9781319013387Author:David S. Moore, George P. McCabe, Bruce A. CraigPublisher:W. H. Freeman
MATLAB: An Introduction with Applications
Statistics
ISBN:9781119256830
Author:Amos Gilat
Publisher:John Wiley & Sons Inc
Probability and Statistics for Engineering and th...
Statistics
ISBN:9781305251809
Author:Jay L. Devore
Publisher:Cengage Learning
Statistics for The Behavioral Sciences (MindTap C...
Statistics
ISBN:9781305504912
Author:Frederick J Gravetter, Larry B. Wallnau
Publisher:Cengage Learning
Elementary Statistics: Picturing the World (7th E...
Statistics
ISBN:9780134683416
Author:Ron Larson, Betsy Farber
Publisher:PEARSON
The Basic Practice of Statistics
Statistics
ISBN:9781319042578
Author:David S. Moore, William I. Notz, Michael A. Fligner
Publisher:W. H. Freeman
Introduction to the Practice of Statistics
Statistics
ISBN:9781319013387
Author:David S. Moore, George P. McCabe, Bruce A. Craig
Publisher:W. H. Freeman