Essentials Of Investments
11th Edition
ISBN: 9781260013924
Author: Bodie, Zvi, Kane, Alex, MARCUS, Alan J.
Publisher: Mcgraw-hill Education,
expand_more
expand_more
format_list_bulleted
Question
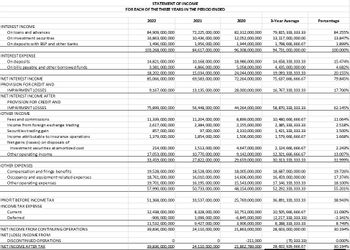
E.v.a.l.u.a.t.e. .a.n.d. .e.x.p.l.a.i.n. .t.h.e. .s.t.a.t.e.m.e.n.t. .o.f. i.n.c.o.m.e. .b.e.l.o.w.

Transcribed Image Text:INTEREST INCOME
On loans and advances
On investment securities
On deposits with BSP and other banks
INTEREST EXPENSE
On deposits
On bills payable and other borrowed funds
NET INTEREST INCOME
PROVISION FOR CREDIT AND
IMPAIRMENT LOSSES
NET INTEREST INCOME AFTER
PROVISION FOR CREDIT AND
IMPAIRMENT LOSSES
OTHER INCOME
Fees and commissions
yees and com
Income from foreign exchange trading
Securities trading gain
Income attributable to insurance operations
Netgains (losses) on disposals of
investment securities at amortized cost
Other operating income
OTHER EXPENSES
Compensation and fringe benefits
Occupancy and equipment-related expenses
Other operating expenses
PROFIT BEFORE INCOME TAX
INCOME TAX EXPENSE
Current
Deferred
NET INCOME FROM CONTINUING OPERATIONS
NET (LOSS) INCOME FROM
DISCONTINUED OPERATIONS
NET INCOME AFTER TAX
STATEMENT OF INCOME
FOR EACH OF THE THREE YEARS IN THE PERIOD ENDED
2022
84,909,000,000
16,863,000,000
1,496,000,000
103,268,000,000
14,821,000,000
3,381,000,000
18,202,000,000
85,066,000,000
9,167,000,000
75,899,000,000
11,339,000,000
2,617,000,000
857,000,000
1,379,000,000
214,000,000
17,053,000,000
33,459,000,000
19,528,000,000
18,761,000,000
19,701,000,000
57,990,000,000
51,368,000,000
12,438,000,000
-906,000,000
11,532,000,000
39,836,000,000
0
39,836,000,000
2021
72.225,000,000
10,436,000,000
1,956,000,000
84,617,000,000
10,168,000,000
4,866,000,000
15,034,000,000
69,583,000,000
13,135,000,000
56,448,000,000
11,204,000,000
2,384,000,000
97,000,000
1,854,000,000
1,513,000,000
10,770,000,000
27,822,000,000
18,528,000,000
16,010,000,000
16,195,000,000
50,733,000,000
33,537,000,000
8,328,000,000
1,099,000,000
9,427,000,000
24.110,000,000
0
24,110,000,000
2020
82,312,000,000
12,052,000,000
1,944,000,000
96,308,000,000
18,986,000,000
5,058,000,000
24,044,000,000
72,264,000,000
28,000,000,000
44,264,000,000
8,899,000,000
2,155,000,000
3,310,000,000
1,506,000,000
4,647,000,000
9,142,000,000
29,659,000,000
18,005,000,000
14,606,000,000
15,543,000,000
48,154,000,000
25,769,000,000
10,751,000,000
-6,845,000,000
3.906,000,000
21.863,000,000
-211,000
21,862,789,000
3-Year Average
79,815,333, 333.33
13,117,000,000,00
1,798, 666,666.67
94,731,000,000.00
14,658, 333, 333.33
4,435,000,000.00
19,093,333, 333.33
75,637,666,666.67
16,767,333,333.33
58,870, 333, 333.33
10,480, 666,666.67
2,385, 333, 333.33
1,421,333, 333.33
1,579,666,666.67
2,124,666,666.67
12,321, 666,666.67
30, 313, 333, 333.33
18,687,000,000.00
16,459,000,000.00
17,146,333,333.33
52, 292, 333, 333.33
36,891,333, 333.33
10,505,666,666.67
(2,217,333, 333.33)
8,288, 333, 333.33
28,603,000,000.00
(70,333.33)
28,602,929,666.67
Percentage
84.255%
13.847%
1.899%
100.000%
15.474%
4.682%
20.155%
79.845%
17.700%
62.145%
11.064%
2.518 %
1.500%
1.668%
2.243%
13.007%
31.999%
19.726%
17.374%
18.100%
55.201%
38.943%
11.090%
-2.341%
8.749%
30.194%
0.000%
30.194%
Expert Solution
This question has been solved!
Explore an expertly crafted, step-by-step solution for a thorough understanding of key concepts.
Step by stepSolved in 3 steps

Knowledge Booster
Similar questions
- D.e.d.u.c.t.i.o.n.s. .f.r.o.m. .G.r.o.s.s. .I.n.c.o.m.e. N.o.t.e.:. .I.n.c.o.m.e. .t.a.x.a.t.i.o.n. .-. .P.h.i.l.i.p.p.i.n.e.s. .b.a.s.e.d D.e.f.i.n.e. .".b.u.s.i.n.e.s..s ..e.x.p.e.n.s.e.s...".?. .D.i.f.f.e.r.e.n.t.i.a.t..e. .t.he. ..a.l.l.o.w.a.b.l.e. O.S.D. .f.o.r. .i.n.d.i.v.i.d.u.a.l. .f.r.o..m .t.h.a.t. .o.f. .t.h.e. .c.o.r.p.o.r.a.t.i.o.n. E.n.u.m.e.r.a.t.e. .t.h.e. .t.a.x.p.a.y.e.r.s. .t.h.a.t. .a.r.e. .a.l.l.o.w.e.d .t.o. .d.e.d.u.c.t. .O.S.D. C.a.n. .a. .h..u.s.b.a.n.d. .c.l.a..i.m .O.S.D. ..w.h.i.le. .t.h.e. .w.i.f.e.. .cl.a.i.m.. i.t.e.m.i.z.e.d. .d.e.d..u.c.t.i.o.n.s. .(.v.i.s.e.. .v.e.r.s.a.). .i.n. .t.h.e.i.r.. c.o.n.s.o.l.i.d.a.t..ed. .I.T.R.?.. .J.u.s.t.i.f.y. .y.o.u.r. .a.n.s..w.e.r. D.e.f.i.n.e. ."..i.t.e.m.i.z.e.d. .d.e.d.u.c.t..i.o.n.s..".?.. E.n.u.m.e.r.a.t.e. .t.h.e. .i.n.c.o.m.e.s. .t.h.a.t. .a.r.e. .g.r.a.n.t.e.d. .w.i.t.h. .a.l.l.o.w.a.b.l.e. .i.t.e.m.i.z.e.d. .d.e.d.u.c.t.i.o.n.s. W.h.a.t. .i.s. .a. .".g.e.n.e.r.a.l. .b.u.s.i.n.e.s.s. .e.x.p.e.n.s.e.s.".?.…arrow_forwardE.v.a.l.u.a.t.e. .a.n.d. .e.x.p.l.a.i.n. .t.h.e. .s.t.a.t.e.m.e.n.t. .o.f. .f.i.n.a.n.c.i.a.l. .p.o.s.i.t.i.o.n. .b.e.l.o.w.arrow_forwardMa1. Please give only typed answer.arrow_forward
Recommended textbooks for you
 Essentials Of InvestmentsFinanceISBN:9781260013924Author:Bodie, Zvi, Kane, Alex, MARCUS, Alan J.Publisher:Mcgraw-hill Education,

 Foundations Of FinanceFinanceISBN:9780134897264Author:KEOWN, Arthur J., Martin, John D., PETTY, J. WilliamPublisher:Pearson,
 Fundamentals of Financial Management (MindTap Cou...FinanceISBN:9781337395250Author:Eugene F. Brigham, Joel F. HoustonPublisher:Cengage Learning
 Corporate Finance (The Mcgraw-hill/Irwin Series i...FinanceISBN:9780077861759Author:Stephen A. Ross Franco Modigliani Professor of Financial Economics Professor, Randolph W Westerfield Robert R. Dockson Deans Chair in Bus. Admin., Jeffrey Jaffe, Bradford D Jordan ProfessorPublisher:McGraw-Hill Education

Essentials Of Investments
Finance
ISBN:9781260013924
Author:Bodie, Zvi, Kane, Alex, MARCUS, Alan J.
Publisher:Mcgraw-hill Education,


Foundations Of Finance
Finance
ISBN:9780134897264
Author:KEOWN, Arthur J., Martin, John D., PETTY, J. William
Publisher:Pearson,

Fundamentals of Financial Management (MindTap Cou...
Finance
ISBN:9781337395250
Author:Eugene F. Brigham, Joel F. Houston
Publisher:Cengage Learning

Corporate Finance (The Mcgraw-hill/Irwin Series i...
Finance
ISBN:9780077861759
Author:Stephen A. Ross Franco Modigliani Professor of Financial Economics Professor, Randolph W Westerfield Robert R. Dockson Deans Chair in Bus. Admin., Jeffrey Jaffe, Bradford D Jordan Professor
Publisher:McGraw-Hill Education