
MATLAB: An Introduction with Applications
6th Edition
ISBN: 9781119256830
Author: Amos Gilat
Publisher: John Wiley & Sons Inc
expand_more
expand_more
format_list_bulleted
Related questions
Topic Video
Question
can you please help with 7.3.1
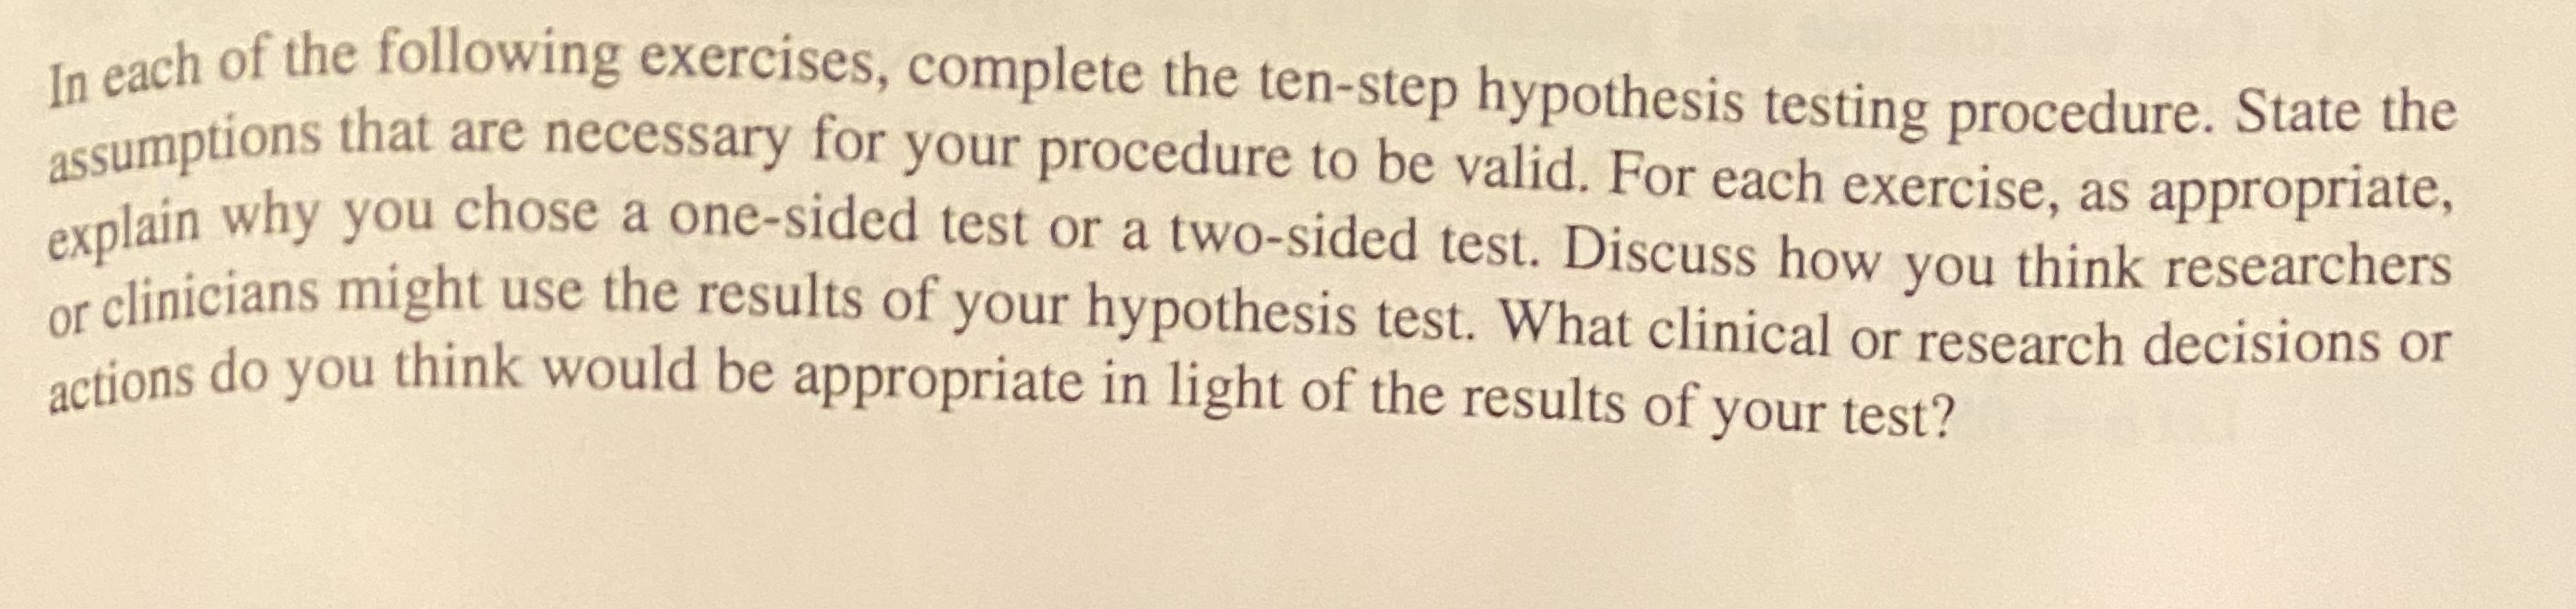

Transcribed Image Text:te cach of the following exercises, complete the ten-step hypothesis testing procedure. State the
assumptions that are necessary for your procedure to be valid. For each exercise, as appropriate,
olain why you chose a one-sided test or a two-sided test. Discuss how you think researchers
or clinicians might use the results of your hypothesis test. What clinical or research decisions or
actions do you think would be appropriate in light of the results of your test?
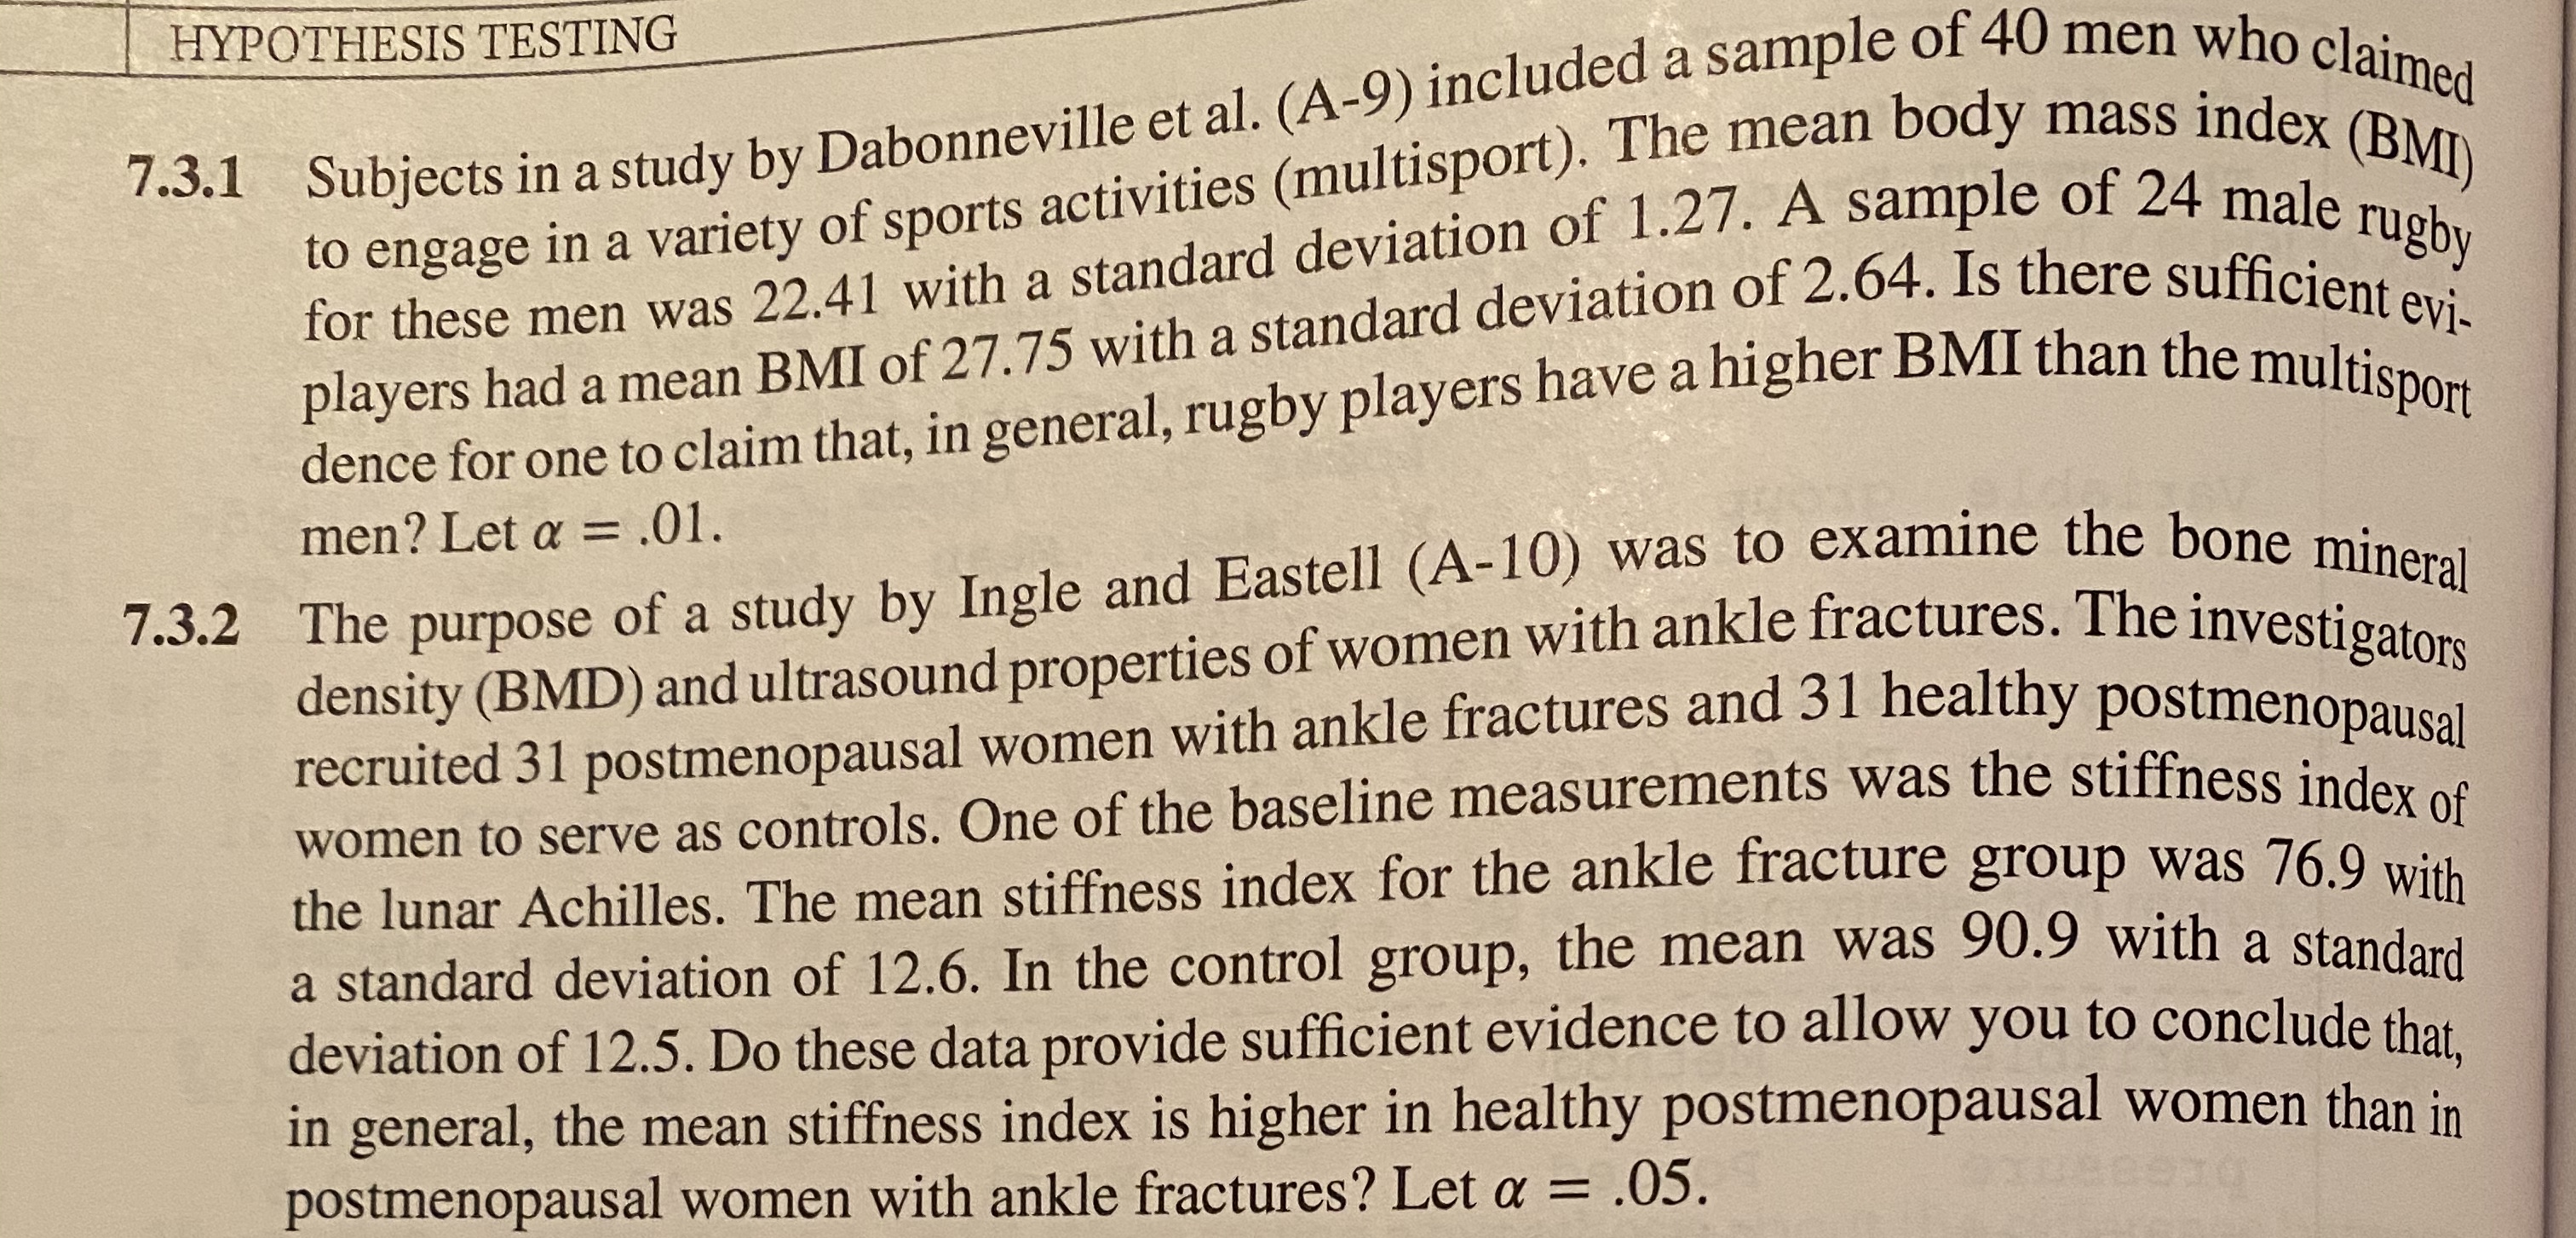
Transcribed Image Text:HYPOTHESIS TESTING
to engage in a variety of sports activities (multisport). The mean body mass indey
for these men was 22.41 with a standard deviation of 1.27. A sample of 24 male,
players had a mean BMI of 27.75 with a standard deviation of 2.64. Is there sufficient evì-
7.3.1 Subjects in a study by Dabonneville et al. (A-9) included a sample of 40 men who claimed
(BMI)
rugby
n general, rugby players have a higher BMI than the multisport
dence for one to claim that,
7.3.2 The purpose of a study by Ingle and Eastell (A-10) was to examine the bone mineral
density (BMD) and ultrasound properties of women with ankle fractures. The investigators
recruited 31 postmenopausal women with ankle fractures and 31 healthy postmenopausal
men? Let a =
= .01.
women to serve as controls. One of the baseline measurements was the stiffness inder
the lunar Achilles. The mean stiffness index for the ankle fracture group was 76.9 with
a standard deviation of 12.6. In the control group, the mean was 90.9 with a standard
deviation of 12.5. Do these data provide sufficient evidence to allow you to conclude that
in general, the mean stiffness index is higher in healthy postmenopausal women than in
postmenopausal women with ankle fractures? Let a = .05.
uecend
Expert Solution
This question has been solved!
Explore an expertly crafted, step-by-step solution for a thorough understanding of key concepts.

This is a popular solution

Trending nowThis is a popular solution!

Step by stepSolved in 2 steps with 3 images

Knowledge Booster


Learn more about
Need a deep-dive on the concept behind this application? Look no further. Learn more about this topic, statistics and related others by exploring similar questions and additional content below.Similar questions
- calculatearrow_forwardSuppose you have a sample of five observations of a variable x, which take the values 3, 0, 1, 6, 0. Round answers to two decimal places when necessary (e.g., 1/3=0.33 or 0.567=0.57). 1. What is the sample mean? Sample mean%=D 2. What is the sample variance? Sample variance= 17.75 3. What is the mode? Mode= 0 4. Of the sample statistics: A) mean; B) median; or C) mode, which is the most sensitive to outliers? Enter your answer as the letter A, B, or C. The is most sensitive to outliers Answer 1: You Answered Correct Answerarrow_forwardDescribe how to represent 0.0278 with bundles of small objects. In this case, what does one small object represent?arrow_forward
- Are you 100% sure about the answer?Also, can you rewrite it in neat handwriting please!arrow_forwardthe average household income of Georgia is 89,679.25 and median household income for Georgia is 59,235 Is the median always lower than average? If not, please elaborate and provide an example that indicates opposite results.arrow_forwardWhat is the interquartile range of 32, 21, 17, 38 and 6.arrow_forward
arrow_back_ios
arrow_forward_ios
Recommended textbooks for you
- MATLAB: An Introduction with ApplicationsStatisticsISBN:9781119256830Author:Amos GilatPublisher:John Wiley & Sons Inc
 Probability and Statistics for Engineering and th...StatisticsISBN:9781305251809Author:Jay L. DevorePublisher:Cengage Learning
 Statistics for The Behavioral Sciences (MindTap C...StatisticsISBN:9781305504912Author:Frederick J Gravetter, Larry B. WallnauPublisher:Cengage Learning
  Elementary Statistics: Picturing the World (7th E...StatisticsISBN:9780134683416Author:Ron Larson, Betsy FarberPublisher:PEARSON
 The Basic Practice of StatisticsStatisticsISBN:9781319042578Author:David S. Moore, William I. Notz, Michael A. FlignerPublisher:W. H. Freeman
 Introduction to the Practice of StatisticsStatisticsISBN:9781319013387Author:David S. Moore, George P. McCabe, Bruce A. CraigPublisher:W. H. Freeman
MATLAB: An Introduction with Applications
Statistics
ISBN:9781119256830
Author:Amos Gilat
Publisher:John Wiley & Sons Inc
Probability and Statistics for Engineering and th...
Statistics
ISBN:9781305251809
Author:Jay L. Devore
Publisher:Cengage Learning
Statistics for The Behavioral Sciences (MindTap C...
Statistics
ISBN:9781305504912
Author:Frederick J Gravetter, Larry B. Wallnau
Publisher:Cengage Learning
Elementary Statistics: Picturing the World (7th E...
Statistics
ISBN:9780134683416
Author:Ron Larson, Betsy Farber
Publisher:PEARSON
The Basic Practice of Statistics
Statistics
ISBN:9781319042578
Author:David S. Moore, William I. Notz, Michael A. Fligner
Publisher:W. H. Freeman
Introduction to the Practice of Statistics
Statistics
ISBN:9781319013387
Author:David S. Moore, George P. McCabe, Bruce A. Craig
Publisher:W. H. Freeman