
MATLAB: An Introduction with Applications
6th Edition
ISBN: 9781119256830
Author: Amos Gilat
Publisher: John Wiley & Sons Inc
expand_more
expand_more
format_list_bulleted
Related questions
Question
How can I find this in excel and work it out ?
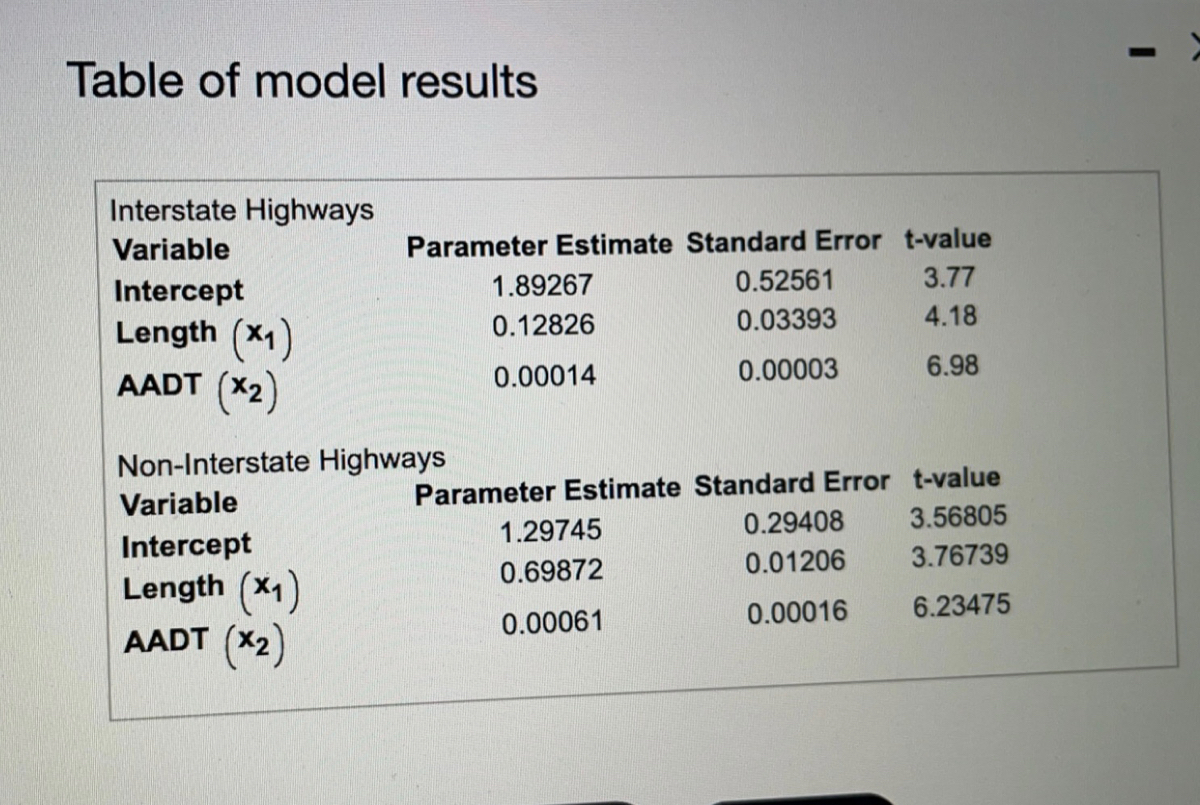

Transcribed Image Text:Table of model results
Interstate Highways
Parameter Estimate Standard Error t-value
3.77
Variable
Intercept
1.89267
0.52561
0.03393
4.18
Length (X1)
AADT (X2)
0.12826
0.00014
0.00003
6.98
Non-Interstate Highways
Parameter Estimate Standard Error t-value
3.56805
Variable
1.29745
0.29408
Intercept
Length (X1)
AADT (X2)
0.01206
3.76739
0.69872
0.00016
6.23475
0.00061

Transcribed Image Text:Researchers developed a safety performance function (SPF), which estimates the probability of occurrence of a crash for a given segment of roadway. Using data on over 100 segments of
roadway, they fit the model E(y) = Bo + B1×1 + B2x2, where y = number of crashes per three years, x, =roadway length (miles), and x2 = average annual daily traffic (number of vehicles) = AADT.
Click here to view the model results
Click here to view a table of critical values of the t distribution.
B. This value has no meaningful interpretation because x, =0 and x2 = 0 are not in the observed range.
O C. We estimate the mean number of crashes per 3 years will increase by B for each additional vehicle per day, holding roadway mileage constant.
Interpret the value of B1. Choose the correct answer below.
A. We estimate the mean number of crashes per 3 years will increase by B for each additional vehicle per day, holding roadway mileage constant.
B. We estimate the mean number of crashes per 3 years will increase by B for each additional mile of roadway, holding AADT constant.
CC. This value has no meaningful interpretation because x, =0 and x, =0 are not in the observed range.
Interpret the value of B2. Choose the correct answer below.
A. We estimate the mean number of crashes per 3 years will increase by B for each additional vehicle per day, holding roadway mileage constant.
B. This value has no meaningful interpretation because x, =0 and x2 = 0 are not in the observed range.
CC. We estimate the mean number of crashes per 3 years will increase by B for each additional mile of roadway, holding AADT constant.
c. Refer to part a. Find a 98% confidence interval for B,.
(Round to five decimal places as needed.)
Expert Solution
This question has been solved!
Explore an expertly crafted, step-by-step solution for a thorough understanding of key concepts.

Step by stepSolved in 3 steps with 2 images

Knowledge Booster

Similar questions
arrow_back_ios
arrow_forward_ios
Recommended textbooks for you
- MATLAB: An Introduction with ApplicationsStatisticsISBN:9781119256830Author:Amos GilatPublisher:John Wiley & Sons Inc
 Probability and Statistics for Engineering and th...StatisticsISBN:9781305251809Author:Jay L. DevorePublisher:Cengage Learning
 Statistics for The Behavioral Sciences (MindTap C...StatisticsISBN:9781305504912Author:Frederick J Gravetter, Larry B. WallnauPublisher:Cengage Learning
  Elementary Statistics: Picturing the World (7th E...StatisticsISBN:9780134683416Author:Ron Larson, Betsy FarberPublisher:PEARSON
 The Basic Practice of StatisticsStatisticsISBN:9781319042578Author:David S. Moore, William I. Notz, Michael A. FlignerPublisher:W. H. Freeman
 Introduction to the Practice of StatisticsStatisticsISBN:9781319013387Author:David S. Moore, George P. McCabe, Bruce A. CraigPublisher:W. H. Freeman
MATLAB: An Introduction with Applications
Statistics
ISBN:9781119256830
Author:Amos Gilat
Publisher:John Wiley & Sons Inc
Probability and Statistics for Engineering and th...
Statistics
ISBN:9781305251809
Author:Jay L. Devore
Publisher:Cengage Learning
Statistics for The Behavioral Sciences (MindTap C...
Statistics
ISBN:9781305504912
Author:Frederick J Gravetter, Larry B. Wallnau
Publisher:Cengage Learning
Elementary Statistics: Picturing the World (7th E...
Statistics
ISBN:9780134683416
Author:Ron Larson, Betsy Farber
Publisher:PEARSON
The Basic Practice of Statistics
Statistics
ISBN:9781319042578
Author:David S. Moore, William I. Notz, Michael A. Fligner
Publisher:W. H. Freeman
Introduction to the Practice of Statistics
Statistics
ISBN:9781319013387
Author:David S. Moore, George P. McCabe, Bruce A. Craig
Publisher:W. H. Freeman