
Glencoe Algebra 1, Student Edition, 9780079039897, 0079039898, 2018
18th Edition
ISBN: 9780079039897
Author: Carter
Publisher: McGraw Hill
expand_more
expand_more
format_list_bulleted
Related questions
Question
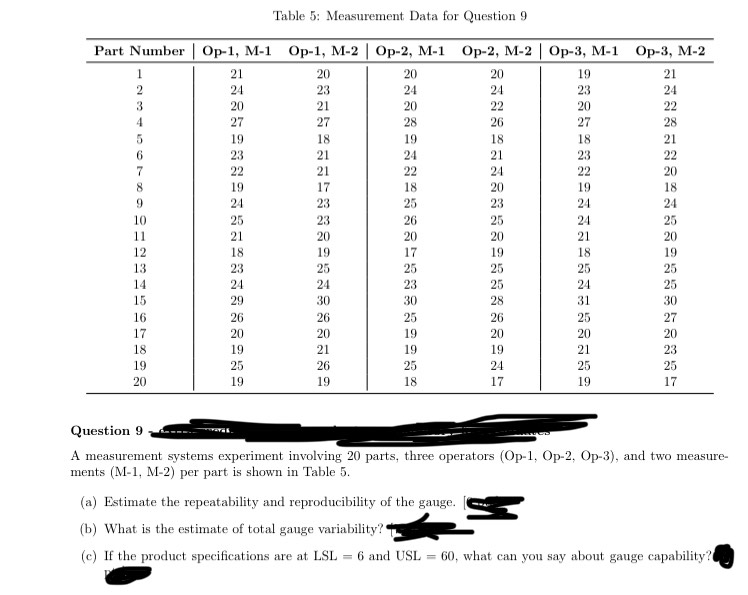

Transcribed Image Text:Table 5: Measurement Data for Question 9
Part Number
Op-1, M-1
Op-1, M-2 | Op-2, M-1 Op-2, M-2 | Op-3, M-1
Op-3, M-2
1
21
20
20
20
19
21
2
24
23
24
24
23
24
3
4
5
6
7
8
9
10
11
21
12
8222332
201
21
20
22
20
22
27
27
28
26
27
28
19
18
19
21
24
21
22
19
17
18
24
23
25
25
23
26
20
20
18
19
17
13
23
25
25
2 3 3 3 3 2 3
18
18
21
21
23
22
24
22
20
19
23
24
25
24
20
21
19
18
25
25
14
24
24
23
25
24
15
29
30
30
28
31
16
26
26
25
26
25
17
20
20
19
20
20
843882388
20
18
25
20
19
25
25
30
27
20
18
19
21
19
19
21
23
19
25
26
25
24
25
25
20
19
19
18
17
19
17
Question 9
A measurement systems experiment involving 20 parts, three operators (Op-1, Op-2, Op-3), and two measure-
ments (M-1, M-2) per part is shown in Table 5.
(a) Estimate the repeatability and reproducibility of the gauge.
(b) What is the estimate of total gauge variability?"
(c) If the product specifications are at LSL = 6 and USL 60, what can you say about gauge capability?
Expert Solution
This question has been solved!
Explore an expertly crafted, step-by-step solution for a thorough understanding of key concepts.

Step by stepSolved in 2 steps with 3 images

Knowledge Booster

Similar questions
- 6 Assignment name: Unit 8 Progres x + A apclassroom.collegeboard.org/33/assessments/assignments/33271022 CollegeBoard AP Classroom Unit 8 Progress Check: MCQ Part B Ricky Lamas 10 11 12 (13 15 Question 14 W A political analyst wanted to see whether there is an association between political affiliation and where a person lives. The analyst took a random sample of 1,250 people in a state and asked them which political party they were affiliated with and what county they lived in. The following are the hypotheses the analyst tested. Ho : There is no association between party affiliation and the county in which a person lives. Ha: There is an association between party affiliation and the county in which a person lives. Submit The chi-square test statistic and p-value of the hypothesis test were 19.78 and 0.003 respectively. Which of the following conclusions should be made about political affiliation and where a person lives? A There is convincing statistical evidence to suggest that…arrow_forward3. Two analysts were given a standard reference material (SRM) and were asked to determine its copper concentration (in mg/kg) using the EPA standard method. Each analyst was given sufficient time so they could produce as many accurate results as possible. Their results (mg/kg) were as follows: Analyst A 45.2, 47.3, 51.2, 50.4, 52.2, 48.7 (Standard error s = 2.62) Analyst B 49.4, 50.3, 51.6, 52.1, 50.9 (Standard error s = 1.06) (a) For Analyst A, is 52.2 mg/kg a possible outlier? (b) Calculate the RSD for each student; which analyst is more precise? (c) If the known concentration of copper in SRM is 49.5 mg/kg, which analyst is more accurate (without considering the deletion of outliers if any)?arrow_forwardWhat other options are there to guarantee the accuracy of the data collected in the field?arrow_forward
- A researcher is studying the relationship between sugar consumption and weight gain. Twelve volunteers were randomly assigned to one of two groups. The first group had five participants which were put on a diet low in sugar and the other group with the remaining seven participants received 10% of their calories from sugar. After 8 weeks, weight gain was recorded from each participant. a) Explanatory variable: (weight, 10% calories, Sugar consumption, weight gain) b) Response variable: (weight gain, type of diet for severe participants, sugar consumption) c) Which of the following principles was not used in this study? A. Replication B. Blinding C. Randomization D. Control d) This study is a(n) (Survey, observational, experimental) study. e) The ‘low sugar’ group can be thought of as a control group. The control group is being used in this experiment to avoid (republication, confounding with…arrow_forwardwhat are the four imporatant sources of data?arrow_forwardAs part of an evaluation program, a sport goods retailer wanted to compare the downhill coasting speeds of 4 brands of bicycles. She took 3 of each brand and determined their maximum downhill speeds. The results are presented in miles per hour in Table 2 below. Table 2 Trial Connondale Kona Bike Bianch Orbea 43 37 41 43 46 38 45 45 3 43 39 42 46 The data collected was analyzed and Output 2 is shown below. Output 2 Source of Variation Bicydle Brands df MS F p-value 81.33 27.11 10.17 0.004 Error 21.33 2.67 Total 11 102.67 At the 0.01 level of significance, is there sufficient evidence to conclude that the mean of downhill coasting speeds is not the same for the four different brands of bicycles? (Use critical value method and P-value method)arrow_forward
- iris is a built-in R data set (data frame). This data set contains gives the measurements in centimeters of the variables sepal length and width and petal length and width, respectively, for 50 flowers from each of 3 species of iris. The species are Iris setosa, versicolor, and virginica. We are interested in some descriptive statistics related to the Sepal.Width column of the data frame. We can access the data directly by using the assignment x <- iris$Sepal.Width (In R use ?iris for info on this dataset.)Remember: x <- iris$Sepal.Widtha.Calculate the sample median of x. b. Using the R quantile function, find the .80 quantile of x.(80th percentile) c. Calculate the interquartile range of x using R. d. Calculate the sample mean of x. e. Calculate a 4% trimmed mean for x. f. Calculate the sample variance of x. g. Calculate the sample standard deviation of x. h. What proportion of the x values are within 2.0 sample standard deviations from the sample mean i. Calculate the minimum…arrow_forwardFour different formulations of an industrial glue are being tested. Each of the different formulations were randomly applied to joint parts of five test specimen and the tensile strength of the glue when it is applied to each test specimen is recorded. However, the tensile strength is also related to the application thickness. The data on the strength (in lbs) and thickness (in 0.01 inches) are shown in the following table. Identify the treatment (specify levels), experimental units, concomitant variable, and response variable.arrow_forwardI need help with question 19 pleasearrow_forward
- 4.2#12 Amwser question 12arrow_forwardNumber 14 parts d and e.arrow_forward15. A study is conducted to compare mean cholesterol conventional (low-fat, low-calorie) diet for at least 6 months. The data are summarized in Table 7-59. levels for individuals following a low-carbohydrate diet for at least 6 months to individuals following a onventional (low-fat, low-calorie) diet for at least k months. The data are summarized in Table 7-59. Test if there is a significant difference in mean cho- lesterol levels between the diet programs using a 5% level of significance. 16. Another outcome variable in the study described in Problem 15 is hypercholesterolemia, defined as total cholesterol over 220. Among the individuals who follow the low-carbohydrate diet, 56% are hypercholesterolemic, and among the individu- als who follow the conventional diet, 40% are hypercholesterolemic. Test if there is a significant difference in the proportions using a 5% level of significance. 1 characteristicsarrow_forward
arrow_back_ios
SEE MORE QUESTIONS
arrow_forward_ios
Recommended textbooks for you
- Glencoe Algebra 1, Student Edition, 9780079039897...AlgebraISBN:9780079039897Author:CarterPublisher:McGraw Hill
 Big Ideas Math A Bridge To Success Algebra 1: Stu...AlgebraISBN:9781680331141Author:HOUGHTON MIFFLIN HARCOURTPublisher:Houghton Mifflin Harcourt
Glencoe Algebra 1, Student Edition, 9780079039897...
Algebra
ISBN:9780079039897
Author:Carter
Publisher:McGraw Hill
Big Ideas Math A Bridge To Success Algebra 1: Stu...
Algebra
ISBN:9781680331141
Author:HOUGHTON MIFFLIN HARCOURT
Publisher:Houghton Mifflin Harcourt