Question
thumb_up100%
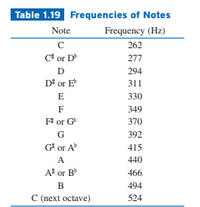
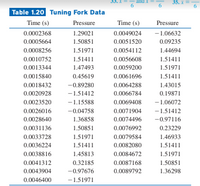
A musical note like that produced with a tun- ing fork or pitch meter is a pressure wave. Table 1.19 gives fre- quencies (in Hz) of musical notes on the tempered scale. The pressure versus time tuning fork data in Table 1.20 were col- lected using a CBLTM and a microphone. (pictures added)
(a) Find a sinusoidal regression equation for the data in Table
1.20 and superimpose its graph on a scatter plot of the data.
(b) Determine the frequency of and identify the musical note
produced by the tuning fork.

Transcribed Image Text:Table 1.19 Frequencies of Notes
Note
Frequency (Hz)
262
C* or D
277
D
294
D' or E
311
E
330
F
349
Fi or G
370
G
392
G' or A
415
A
440
A' or B
466
B
494
C (next octave)
524

Transcribed Image Text:33.
and x
35. x=
6
Table 1.20 Tuning Fork Data
Time (s)
Pressure
Time (s)
Pressure
0.0002368
1.29021
0.0049024
-1.06632
0.0005664
1.50851
0.0051520
0.09235
0.0008256
1.51971
0.0054112
1.44694
0.0010752
1.51411
0.0056608
1.51411
0.0013344
1.47493
0.0059200
1.51971
0.0015840
0.45619
0.0061696
1.51411
0.0018432
-0.89280
0.0064288
1.43015
0.0020928
-1.51412
0.0066784
0.19871
0.0023520
-1.15588
0.0069408
-1.06072
0.0026016
-0.04758
0.0071904
-1.51412
0.0028640
1.36858
0.0074496
-0.97116
0.0031136
1.50851
0.0076992
0.23229
0.0033728
1.51971
0.0079584
1.46933
0.0036224
1.51411
0.0082080
1.51411
0.0038816
1.45813
0.0084672
1.51971
0.0041312
0.32185
0.0087168
1.50851
0.0043904
-0.97676
0.0089792
1.36298
0.0046400
-1.51971
Expert Solution
This question has been solved!
Explore an expertly crafted, step-by-step solution for a thorough understanding of key concepts.
This is a popular solution
Trending nowThis is a popular solution!
Step by stepSolved in 2 steps with 1 images

Knowledge Booster
Similar questions
- A pipe closed at one end has a first overtone of 489 Hz. What is the second overtone in Hz?arrow_forwardWe will assume that a sound wave, once generated and emitted, will propagate uniformly in all directions of 3-dimensional space. Find an expression for the displacement s(r, t) of the air particles from equilibrium, where r is the radial distance from the source, and t is time. Introduce physical constants/coefficients, with appropriate physical dimensions, when necessary.arrow_forwardUsing the sound level versus frequency plot with equal-loudness curves shown below, calculate the intensity in W/m2 for the 10,000-Hz sound having a loudness of 80 phons. (Use your estimate)arrow_forward
- What is the intensity ratio for a sound level increase of 40 dB?arrow_forwardWhat is the frequency of the third harmonic if the fundamental frequancey is 440 Hz?arrow_forwardWhat is the frequency observed with a wavelengh of (6.1x10^2) nm? Answer with 2 significant figures and it must be in scientific notation. Note: Your answer is assumed to be reduced to the highest power possible. Your Answer: Answer x10arrow_forward
- A closed pipe is 70cm long. Find the frequencies and the first overtone if the speed of sound in the pipe is 343m/s-1.arrow_forwardThe human ear can detect a minimum intensity of Io = 10-12 W/m2, which has a sound intensity of 0 dB.Randomized Variablesβ = 35 dB If the student hears a sound at 35 dB, what is the intensity of the sound?arrow_forward
arrow_back_ios
arrow_forward_ios