
MATLAB: An Introduction with Applications
6th Edition
ISBN: 9781119256830
Author: Amos Gilat
Publisher: John Wiley & Sons Inc
expand_more
expand_more
format_list_bulleted
Related questions
Question
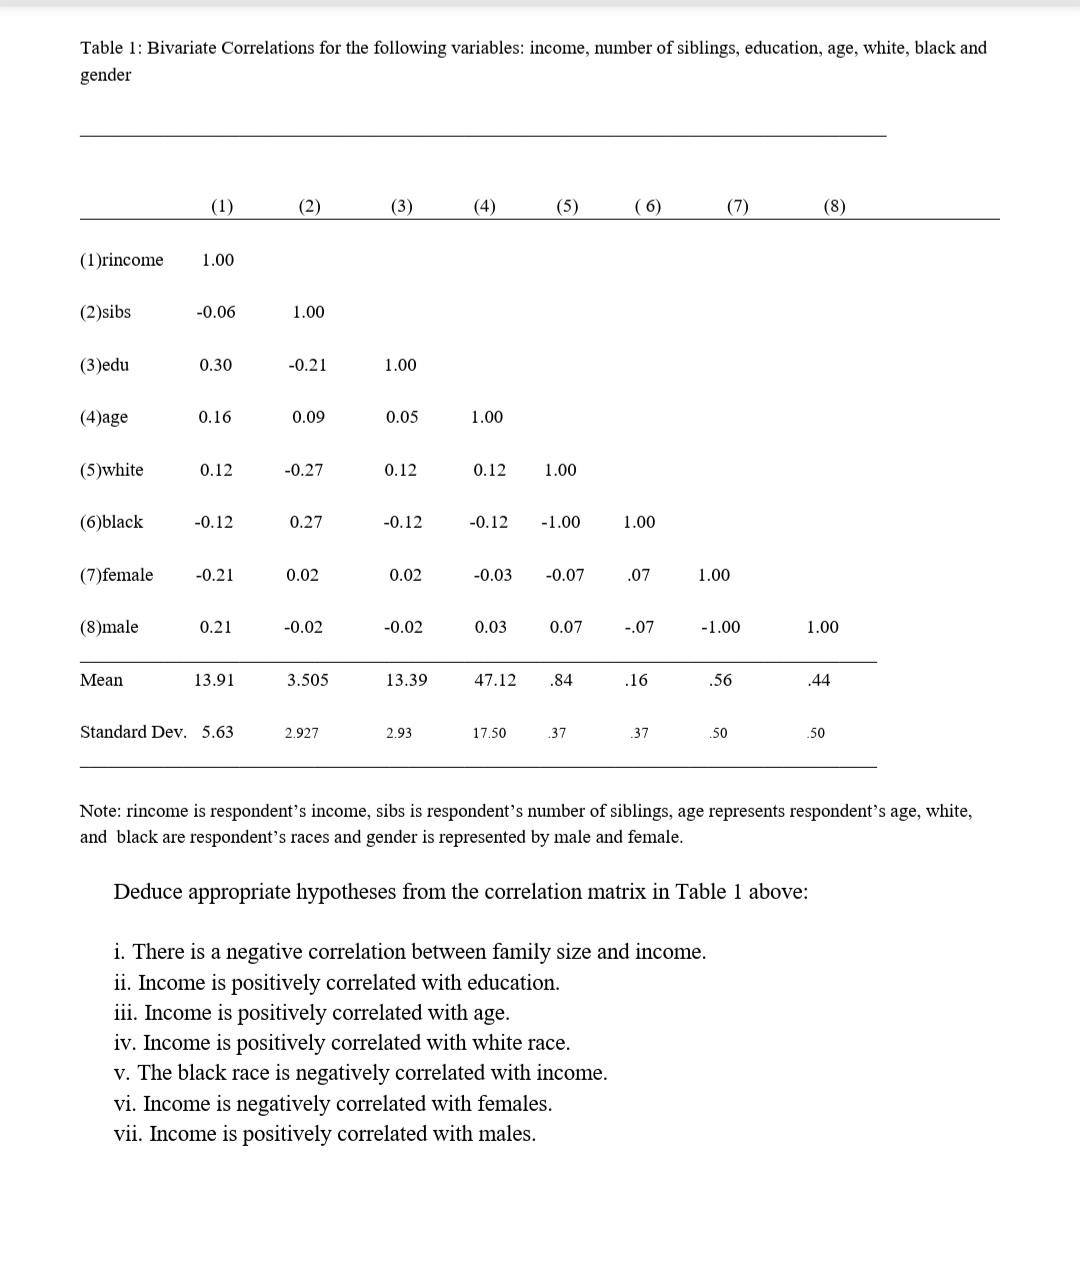

Transcribed Image Text:Table 1: Bivariate Correlations for the following variables: income, number of siblings, education, age, white, black and
gender
(1)rincome 1.00
(2)sibs
(3)edu
(4)age
(5)white
(6)black
(1)
(8)male
Mean
-0.06
0.30
0.16
0.12
(7)female -0.21
-0.12
0.21
13.91
Standard Dev. 5.63
(2)
1.00
-0.21
0.09
-0.27
0.27
0.02
-0.02
3.505
2.927
(3)
1.00
0.05
0.12
-0.12
0.02
-0.02
13.39
2.93
(4)
1.00
0.12
-0.12
0.03
47.12
(5)
-0.03 -0.07
17.50
1.00
-1.00
0.07
.84
.37
(6)
1.00
.07
-.07
.16
.37
(7)
1.00
-1.00
i. There is a negative correlation between family size and income.
ii. Income is positively correlated with education.
iii. Income is positively correlated with age.
iv. Income is positively correlated with white race.
v. The black race is negatively correlated with income.
vi. Income is negatively correlated with females.
vii. Income is positively correlated with males.
.56
.50
(8)
1.00
.44
.50
Note: rincome is respondent's income, sibs is respondent's number of siblings, age represents respondent's age, white,
and black are respondent's races and gender is represented by male and female.
Deduce appropriate hypotheses from the correlation matrix in Table 1 above:
Expert Solution
This question has been solved!
Explore an expertly crafted, step-by-step solution for a thorough understanding of key concepts.

This is a popular solution

Trending nowThis is a popular solution!

Step by stepSolved in 3 steps

Knowledge Booster

Similar questions
- Why should researchers taught to be cautious when interpreting a correlation?arrow_forwardWhy is the combination of the measures of central tendency and measures of variation so informative about a data set? Explain how they work together to provide a complete picture.arrow_forwardWhat is the Small Values of Squared Correlation Coefficient?arrow_forward
- Identify the linear correlation coefficient r , test statistics and pvalue. thank youarrow_forwardA high correlation between two variables does not always mean that changes in one cause changes in the other. The best way to get good evidence that cause-and-effect is present is toarrow_forwardWhat is the correlation coefficient (r) for the best data setarrow_forward
- Is the correlation about 0.02, 0.22, or 0.92 with the outlier? Without this outlier, is the correlation about 0.18, 0.78, or 0.98? Is the outlier is an influential point to the correlation?arrow_forwardIn running a Pearson correlation, you notice that there are a few outliers. Please describe the next course of action, if any, for the dataset and explain your reasoning.arrow_forwardPart A: What is the most likely value of the correlation coefficient of the data in the table? Based on the correlation coefficient, describe the relationship between time and surface area of the lake. [Choose the value of the correlation coefficient from −1, −0.98, −0.5, −0.02.] Part B: What is the value of the slope of the graph of surface area versus time between 15 and 20 days, and what does the slope represent? Part C: Does the data in the table represent correlation or causation? Explain your answer.arrow_forward
arrow_back_ios
SEE MORE QUESTIONS
arrow_forward_ios
Recommended textbooks for you
- MATLAB: An Introduction with ApplicationsStatisticsISBN:9781119256830Author:Amos GilatPublisher:John Wiley & Sons Inc
 Probability and Statistics for Engineering and th...StatisticsISBN:9781305251809Author:Jay L. DevorePublisher:Cengage Learning
 Statistics for The Behavioral Sciences (MindTap C...StatisticsISBN:9781305504912Author:Frederick J Gravetter, Larry B. WallnauPublisher:Cengage Learning
  Elementary Statistics: Picturing the World (7th E...StatisticsISBN:9780134683416Author:Ron Larson, Betsy FarberPublisher:PEARSON
 The Basic Practice of StatisticsStatisticsISBN:9781319042578Author:David S. Moore, William I. Notz, Michael A. FlignerPublisher:W. H. Freeman
 Introduction to the Practice of StatisticsStatisticsISBN:9781319013387Author:David S. Moore, George P. McCabe, Bruce A. CraigPublisher:W. H. Freeman
MATLAB: An Introduction with Applications
Statistics
ISBN:9781119256830
Author:Amos Gilat
Publisher:John Wiley & Sons Inc
Probability and Statistics for Engineering and th...
Statistics
ISBN:9781305251809
Author:Jay L. Devore
Publisher:Cengage Learning
Statistics for The Behavioral Sciences (MindTap C...
Statistics
ISBN:9781305504912
Author:Frederick J Gravetter, Larry B. Wallnau
Publisher:Cengage Learning
Elementary Statistics: Picturing the World (7th E...
Statistics
ISBN:9780134683416
Author:Ron Larson, Betsy Farber
Publisher:PEARSON
The Basic Practice of Statistics
Statistics
ISBN:9781319042578
Author:David S. Moore, William I. Notz, Michael A. Fligner
Publisher:W. H. Freeman
Introduction to the Practice of Statistics
Statistics
ISBN:9781319013387
Author:David S. Moore, George P. McCabe, Bruce A. Craig
Publisher:W. H. Freeman