
MATLAB: An Introduction with Applications
6th Edition
ISBN: 9781119256830
Author: Amos Gilat
Publisher: John Wiley & Sons Inc
expand_more
expand_more
format_list_bulleted
Related questions
Concept explainers
Question
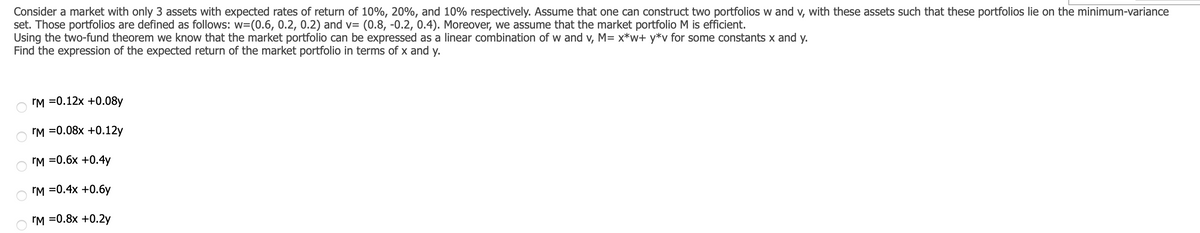

Transcribed Image Text:Consider a market with only 3 assets with expected rates of return of 10%, 20%, and 10% respectively. Assume that one can construct two portfolios w and v, with these assets such that these portfolios lie on the minimum-variance
set. Those portfolios are defined as follows: w=(0.6, 0.2, 0.2) and v= (0.8, -0.2, 0.4). Moreover, we assume that the market portfolio M is efficient.
Using the two-fund theorem we know that the market portfolio can be expressed as a linear combination of w and v, M= x*w+ y*v for some constants x and y.
Find the expression of the expected return of the market portfolio in terms of x and y.
гм 3D0.12х +0.08y
гм 3D0.08х +0.12y
rм 3D0.6х +0.4y
гм 3D0.4x +0.6у
rм 30.8х +0.2у
O O O
Expert Solution
This question has been solved!
Explore an expertly crafted, step-by-step solution for a thorough understanding of key concepts.

This is a popular solution

Trending nowThis is a popular solution!

Step by stepSolved in 2 steps

Knowledge Booster


Learn more about
Need a deep-dive on the concept behind this application? Look no further. Learn more about this topic, statistics and related others by exploring similar questions and additional content below.Similar questions
- A time-series is a vector used to describe a process evolving as a function of time. Suppose c₁ € R³65 and C₂ € R³65 contains the number of cases of a virus over 365 consecutive days. Provide interpretations of the following mathematical statements (1 sentence per response). Interpretations should be in terms of virus cases, and not a re-statement of the mathematical expression. (a) (C₁)k+1 > (C₁)k for k = 1, 2, ..., 364. (b) c ₂ = 0 (c) ||c₁||1 > ||C₂||1, where || ||1 denotes the 1-norm.arrow_forwardThe graph shows that: A) to attain a higher expected return the investor has to tolerate higher risk B) there is a positive linear relationship between expected return and risk C) the mean-return compensations of equal-std-increments decline as we target higher and higher risk D) answers 1 and 3 are correct E)answers 1 and 2 are correctarrow_forwardAn individual has a vNM utility function over money of u(x) = Vx, where x is final wealth. Assume the individual currently has $16. He is offered a lottery with three possible outcomes; he could gain an extra $9, lose $7, or not lose or gain anything. There is a 15% probability that he will win the extra $9. What probability, p, of losing $7 would make the individual indifferent between to play and to not play the lottery? (Make sure to answer in the form, 0.X, i.e. 0.25) Enter your answer herearrow_forward
- Show that if E,=1 a, diverges, then En=1 | |a,| diverges. %3Darrow_forwardNational income from manufacturing industries is to be estimated for 1989 from a sample of 6 of the 19 industry categories that reported figures early for that year. Incomes from all 19 industries are known for 1980 and the total is $674 billion. From the data provided, estimate the total national income from manufacturing in 1989, with a bound on the error. All figures are in billions of constant (1982) dollars. Industry 1980 1989 Lumber and wood products Electrie and electronie 21 63 26 91 equipment Motor vehicles and 91 47 equipment Food and kindred products Textile mill products 70 70 60 70 Chemicals and allied 50 50 products a. Find a ratio estimator of the 1989 total income, and place a bound on the error of estimation. Interpret the results. b. Find a regression estimator of the 1989 total income, and place a bound on the error of estimation. Interpret the results. c. Find a difference estimator of the 1989 total income, and place a bound on the error of estimation. d. Which of…arrow_forwardConsider two assets with returns: rị = 3 (:) r2 = in two states. If the 1 has a return (:) portfolio z = find the value of a.arrow_forward
arrow_back_ios
arrow_forward_ios
Recommended textbooks for you
- MATLAB: An Introduction with ApplicationsStatisticsISBN:9781119256830Author:Amos GilatPublisher:John Wiley & Sons Inc
 Probability and Statistics for Engineering and th...StatisticsISBN:9781305251809Author:Jay L. DevorePublisher:Cengage Learning
 Statistics for The Behavioral Sciences (MindTap C...StatisticsISBN:9781305504912Author:Frederick J Gravetter, Larry B. WallnauPublisher:Cengage Learning
  Elementary Statistics: Picturing the World (7th E...StatisticsISBN:9780134683416Author:Ron Larson, Betsy FarberPublisher:PEARSON
 The Basic Practice of StatisticsStatisticsISBN:9781319042578Author:David S. Moore, William I. Notz, Michael A. FlignerPublisher:W. H. Freeman
 Introduction to the Practice of StatisticsStatisticsISBN:9781319013387Author:David S. Moore, George P. McCabe, Bruce A. CraigPublisher:W. H. Freeman
MATLAB: An Introduction with Applications
Statistics
ISBN:9781119256830
Author:Amos Gilat
Publisher:John Wiley & Sons Inc
Probability and Statistics for Engineering and th...
Statistics
ISBN:9781305251809
Author:Jay L. Devore
Publisher:Cengage Learning
Statistics for The Behavioral Sciences (MindTap C...
Statistics
ISBN:9781305504912
Author:Frederick J Gravetter, Larry B. Wallnau
Publisher:Cengage Learning
Elementary Statistics: Picturing the World (7th E...
Statistics
ISBN:9780134683416
Author:Ron Larson, Betsy Farber
Publisher:PEARSON
The Basic Practice of Statistics
Statistics
ISBN:9781319042578
Author:David S. Moore, William I. Notz, Michael A. Fligner
Publisher:W. H. Freeman
Introduction to the Practice of Statistics
Statistics
ISBN:9781319013387
Author:David S. Moore, George P. McCabe, Bruce A. Craig
Publisher:W. H. Freeman