
MATLAB: An Introduction with Applications
6th Edition
ISBN: 9781119256830
Author: Amos Gilat
Publisher: John Wiley & Sons Inc
expand_more
expand_more
format_list_bulleted
Related questions
Question
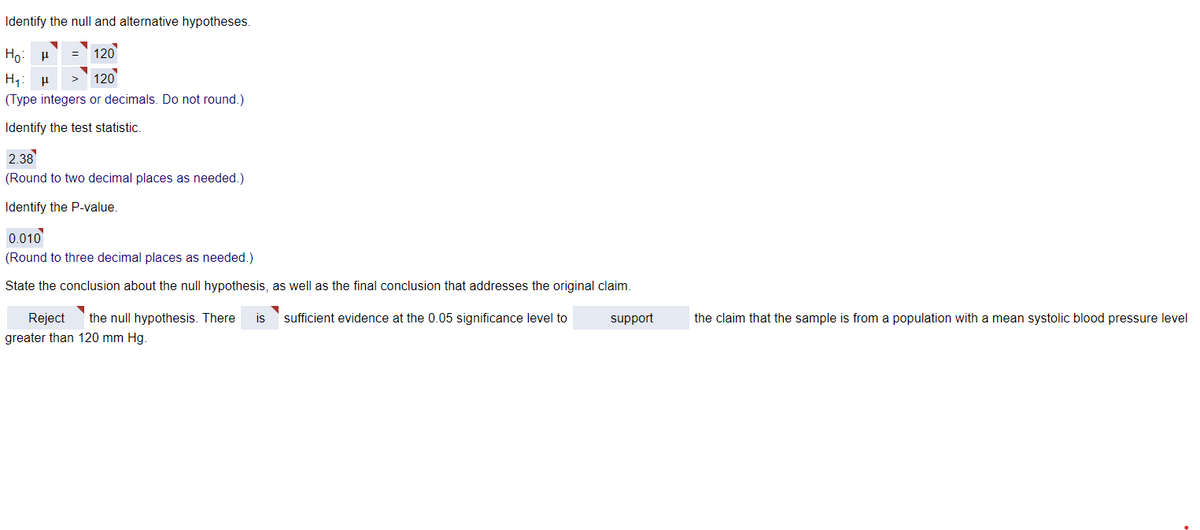

Transcribed Image Text:Identify the null and alternative hypotheses.
Hoμ
= 120
H₁ H > 120
(Type integers or decimals. Do not round.)
Identify the test statistic.
2.38
(Round to two decimal places as needed.)
Identify the P-value.
0.010
(Round to three decimal places as needed.)
State the conclusion about the null hypothesis, as well as the final conclusion that addresses the original claim.
Reject the null hypothesis. There is
greater than 120 mm Hg.
sufficient evidence at the 0.05 significance level to
support
the claim that the sample is from a population with a mean systolic blood pressure level

Transcribed Image Text:Systolic blood pressure levels above 120 mm Hg are considered to be high. For the 100 systolic blood pressure levels listed in the accompanying data set, the mean is 125.70000 mm Hg and the standard
deviation is 15.86146 mm Hg. Assume that a simple random sample has been selected. Use a 0.01 significance level to test the claim that the sample is from a population with a mean greater than 120 mm Hg.
Click the icon to view the data set of systolic blood pressure levels.
Expert Solution
This question has been solved!
Explore an expertly crafted, step-by-step solution for a thorough understanding of key concepts.

Step by stepSolved in 2 steps

Knowledge Booster

Similar questions
- Test the hypothesis using the P-value approach. Be sure to verify the requirements of the test. H0: p=0.7 versus H1: p>0.7 n=200; x=150; α=0.05 Click here to view page 1 of the table. LOADING... Click here to view page 2 of the table. LOADING... Calculate the test statistic, z0. z0=nothing (Round to two decimal places as needed.) Identify the P-value. P-value=nothing (Round to three decimal places as needed.) Choose the correct result of the hypothesis test for the P-value approach below. A. Do not reject the null hypothesis, because the P-value is less than α. B. Do not reject the null hypothesis, because the P-value is greater than α. C. Reject the null hypothesis, because the P-value is greater than α. D. Reject the null hypothesis, because the P-value is less than α.arrow_forwardFind the P-value. (Round to three decimal places as needed.) Based on these results, what is your conclusion? Choose the correct answer below. A. Rejectthe null hypothesis. There is not sufficient evidence of an association between race and the section of the apartment complex in which people live. B. Reject the null hypothesis. There is sufficient evidence of an association between race and the section of the apartment complex in which people live. C. Fail to reject the null hypothesis. There is sufficient evidence of an association between race and the section of the apartment complex in which people live. D. Fail to reject the null hypothesis. There is not sufficient evidence of an association between race and the section of the apartment complex in which people livearrow_forwardClaim: Most adults would erase all of their personal information online if they could, A software firm survey of 586 randomly selected adults showed that 61% of them would erase all of their personal information online if they could. Find the value of the test statistic. The value of the test statistic is. (Round to two decimal places as needed.)arrow_forward
- The proportion of people who live after fighting cancer is 0.75. Suppose there is a new therapy that is used to increase the survival rate. Use the parameter p to represent the population portion of people who survive after fighting cancer. For a hypothesis test of the therapy’s effectiveness, researchers use a null hypothesis of p = 0.75. Pick the correct alternative hypothesis. 1. p > 0.75 2. p < 0.75 3. p 6= 0.75arrow_forwardThe null and alternate hypotheses are: Ho Hy H2 H₁ H₁ H₂ A random sample of 11 observations from one population revealed a sample mean of 23 and a sample standard deviation of 1.1. A random sample of 4 observations from another population revealed a sample mean of 24 and a sample standard deviation of 1.3. The population standard deviations are unknown but assumed to be equal. At the 0.05 significance level, is there a difference between the population means? Required: a. State the decision rule. (Negative amounts should be indicated by a minus sign. Round your answer to 3 decimal places.) Answer is complete but not entirely correct. -1.761 or 1.761 The decision rule is to reject Ho b. Compute the pooled estimate of the population variance. (Round your answer to 3 decimal places.) Pooled estimate of the population variancearrow_forwardTest the hypothesis using the P-value approach. Be sure to verify the requirements of the test. H0: p=0.8 versus H1: p>0.8 n=250; x=215; α=0.1 Click here to view page 1 of the table. LOADING... Click here to view page 2 of the table. LOADING... Calculate the test statistic, z0. z0=nothingarrow_forward
- Test the hypothesis using the P-value approach. Be sure to verify the requirements of the test. H0: p=0.5 versus H1: p>0.5 n=250; x=145; α=0.1 Click here to view page 1 of the table. LOADING... Click here to view page 2 of the table. LOADING...arrow_forwardState whether the standardized test statistic t indicates that you should reject the null hypothesis. Explain. (a) t= 1.584 (b) t=0 (c) t= - 1.526 (d) t= - 1.604 to = - 1.558 (a) For t= 1.584, should you reject or fail to reject the null hypothesis? O A. Fail to reject Ho, because t> - 1.558. O B. Reject Ho, because t> - 1.558. O C. Reject Ho, because t - 1.558. O B. Fail to reject Ho, because t - 1.558. (c) For t= - 1.526, should you reject or fail to reject the null hypothesis? O A. Reject Ho, because t - 1.558. O C. Fail to reject Ho, because t> - 1.558. O D. Fail to reject Hn, because t< - 1.558.arrow_forwardThe null and alternative hypotheses are given. Determine whether the hypothesis test is left-tailed, right-tailed, or two-tailed. What parameter is being tested? Ho: P= 0.76 H₁: p>0.76 Choose the correct answer below. Left-tailed OTwo-tailed Right-tailed BLECHarrow_forward
arrow_back_ios
arrow_forward_ios
Recommended textbooks for you
- MATLAB: An Introduction with ApplicationsStatisticsISBN:9781119256830Author:Amos GilatPublisher:John Wiley & Sons Inc
 Probability and Statistics for Engineering and th...StatisticsISBN:9781305251809Author:Jay L. DevorePublisher:Cengage Learning
 Statistics for The Behavioral Sciences (MindTap C...StatisticsISBN:9781305504912Author:Frederick J Gravetter, Larry B. WallnauPublisher:Cengage Learning
  Elementary Statistics: Picturing the World (7th E...StatisticsISBN:9780134683416Author:Ron Larson, Betsy FarberPublisher:PEARSON
 The Basic Practice of StatisticsStatisticsISBN:9781319042578Author:David S. Moore, William I. Notz, Michael A. FlignerPublisher:W. H. Freeman
 Introduction to the Practice of StatisticsStatisticsISBN:9781319013387Author:David S. Moore, George P. McCabe, Bruce A. CraigPublisher:W. H. Freeman
MATLAB: An Introduction with Applications
Statistics
ISBN:9781119256830
Author:Amos Gilat
Publisher:John Wiley & Sons Inc
Probability and Statistics for Engineering and th...
Statistics
ISBN:9781305251809
Author:Jay L. Devore
Publisher:Cengage Learning
Statistics for The Behavioral Sciences (MindTap C...
Statistics
ISBN:9781305504912
Author:Frederick J Gravetter, Larry B. Wallnau
Publisher:Cengage Learning
Elementary Statistics: Picturing the World (7th E...
Statistics
ISBN:9780134683416
Author:Ron Larson, Betsy Farber
Publisher:PEARSON
The Basic Practice of Statistics
Statistics
ISBN:9781319042578
Author:David S. Moore, William I. Notz, Michael A. Fligner
Publisher:W. H. Freeman
Introduction to the Practice of Statistics
Statistics
ISBN:9781319013387
Author:David S. Moore, George P. McCabe, Bruce A. Craig
Publisher:W. H. Freeman