A First Course in Probability (10th Edition)
10th Edition
ISBN: 9780134753119
Author: Sheldon Ross
Publisher: PEARSON
expand_more
expand_more
format_list_bulleted
Question

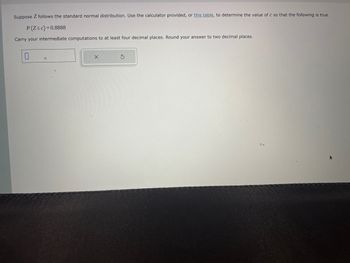
Transcribed Image Text:Suppose Z follows the standard normal distribution. Use the calculator provided, or this table, to determine the value of c so that the following is true.
P(Z≤c)=0.8888
Carry your intermediate computations to at least four decimal places. Round your answer to two decimal places.
X
S
Expert Solution
This question has been solved!
Explore an expertly crafted, step-by-step solution for a thorough understanding of key concepts.
This is a popular solution
Trending nowThis is a popular solution!
Step by stepSolved in 2 steps with 1 images

Knowledge Booster
Similar questions
- One graph in the figure represents a normal distribution with mean u= 15 and standard deviation o = 2. The other graph represents a normal distribution with mean u=11 and standard deviation o = 2. Determine which graph is which and explain how you know. A B 11 15 ... Choose the correct answer below. O A. Graph A has a mean of u = 15 and graph B has a mean of u = 11 because a larger mean shifts the graph to the right. O B. Graph A has a mean of u = 11 and graph B has a mean of u= 15 because a larger mean shifts the graph to the left. O C. Graph A has a mean of u = 11 and graph B has a mean of u = 15 because a larger mean shifts the graph to the right. O D. Graph A has a mean of u = 15 and graph B has a mean of u = 11 because a larger mean shifts the graph to the left.arrow_forwardFind the probability that someone scores between 11 and 16 on the dental anxiety scale. Round to 4 decimal places as needed.arrow_forwardQ.8arrow_forward
- Which statement is true about a normal distribution? O Knowing a data set is normal has no importance in the mathematical and scientific community. O Knowing a data set is normal is only important in producing nicely shaped graphs. O None of the answers listed O Knowing a data set is normal is important in the mathematical and scientific community. 77°F S rcharrow_forwardWhich of the following can NEVER be less than zero. Select all that apply. Group of answer choices probability correlation coefficient interquartile range z-score standard deviationarrow_forwardusing the chi-square distribution table, find the values for x2left and x2right of the following. when a=0.05 n=26 Final answer with 3 decimal points.arrow_forward
- Assume that a randomly selected subject is given a bone density test. Bone density test scores are normally distributed with a mean of 0 and a standard deviation of 1. Draw a graph and find P, the 11th percentile. This is the bone density score separating the bottom 11% from the top 89%. Which graph represents P ? Choose the correct graph below. O A. O B. OD. P11 P11 P11 P11 The bone density score corresponding to P1 is (Round to two decimal places as needed.) Click to select your answer(s). APR tv MacBook Air F9 F10 LLA 20 F3 F6 F8 F4 F5 F1 F2 & #3 7 8. %24arrow_forwardMake a frequency distribution for the data. X f 1 2 2 20 3 21 4 15 The sample mean is x = (Round to one decimal place as needed.)arrow_forwardAssume that the readings on the thermometers are normally distributed with a mean of 0 degrees and standard deviation of 1.00 degrees C. A thermometer is randomly selected and tested. Draw a sketch and find the temperature reading corresponding to Upper P 84, the 84 th percentile. This is the temperature reading separating the bottom 84 % from the top 16 %. A. Which graph represents Upper P 84? B. The temperature for Upper P 84 is approximately (Round to two decimal places as needed.)arrow_forward
- Assume that the readings on the thermometers are normally distributed with a mean of 0° and standard deviation of 1.00°C. A thermometer is randomly selected and tested. Draw a sketch and find the temperature reading corresponding to P34, the 84th percentile. This is the temperature reading separating the bottom 84% from the top 16%. Click to view page 1 of the table. Click to view page 2 of the table. Which graph represents P ? Choose the correct graph below. 84 A. В. OC. D. Ay X The temperature for P84 is approximately (Round to two decimal places as needed.)arrow_forwardusing the chi-square distribution table, find the values for x2left and x2right of the following. when a=0.05 n=26 Final answer with 3 decimal places.arrow_forwardNow find ? + ?. Recall that ? represents the standard deviation. For a normal curve, as we have here, a point three standard deviations to the right of center will be located at the point where the curve is nearly touching the horizontal axis. Observing the graph of the normal curve we see that the point three standard deviations to the right of center is located atx = 91. Therefore, x = 88 is two standard deviations to the right of center and x = is one standard deviation to the right of center.We previously determined that ? = . So, ? + ? = .arrow_forward
arrow_back_ios
arrow_forward_ios
Recommended textbooks for you
 A First Course in Probability (10th Edition)ProbabilityISBN:9780134753119Author:Sheldon RossPublisher:PEARSON

A First Course in Probability (10th Edition)
Probability
ISBN:9780134753119
Author:Sheldon Ross
Publisher:PEARSON
