
MATLAB: An Introduction with Applications
6th Edition
ISBN: 9781119256830
Author: Amos Gilat
Publisher: John Wiley & Sons Inc
expand_more
expand_more
format_list_bulleted
Related questions
Question
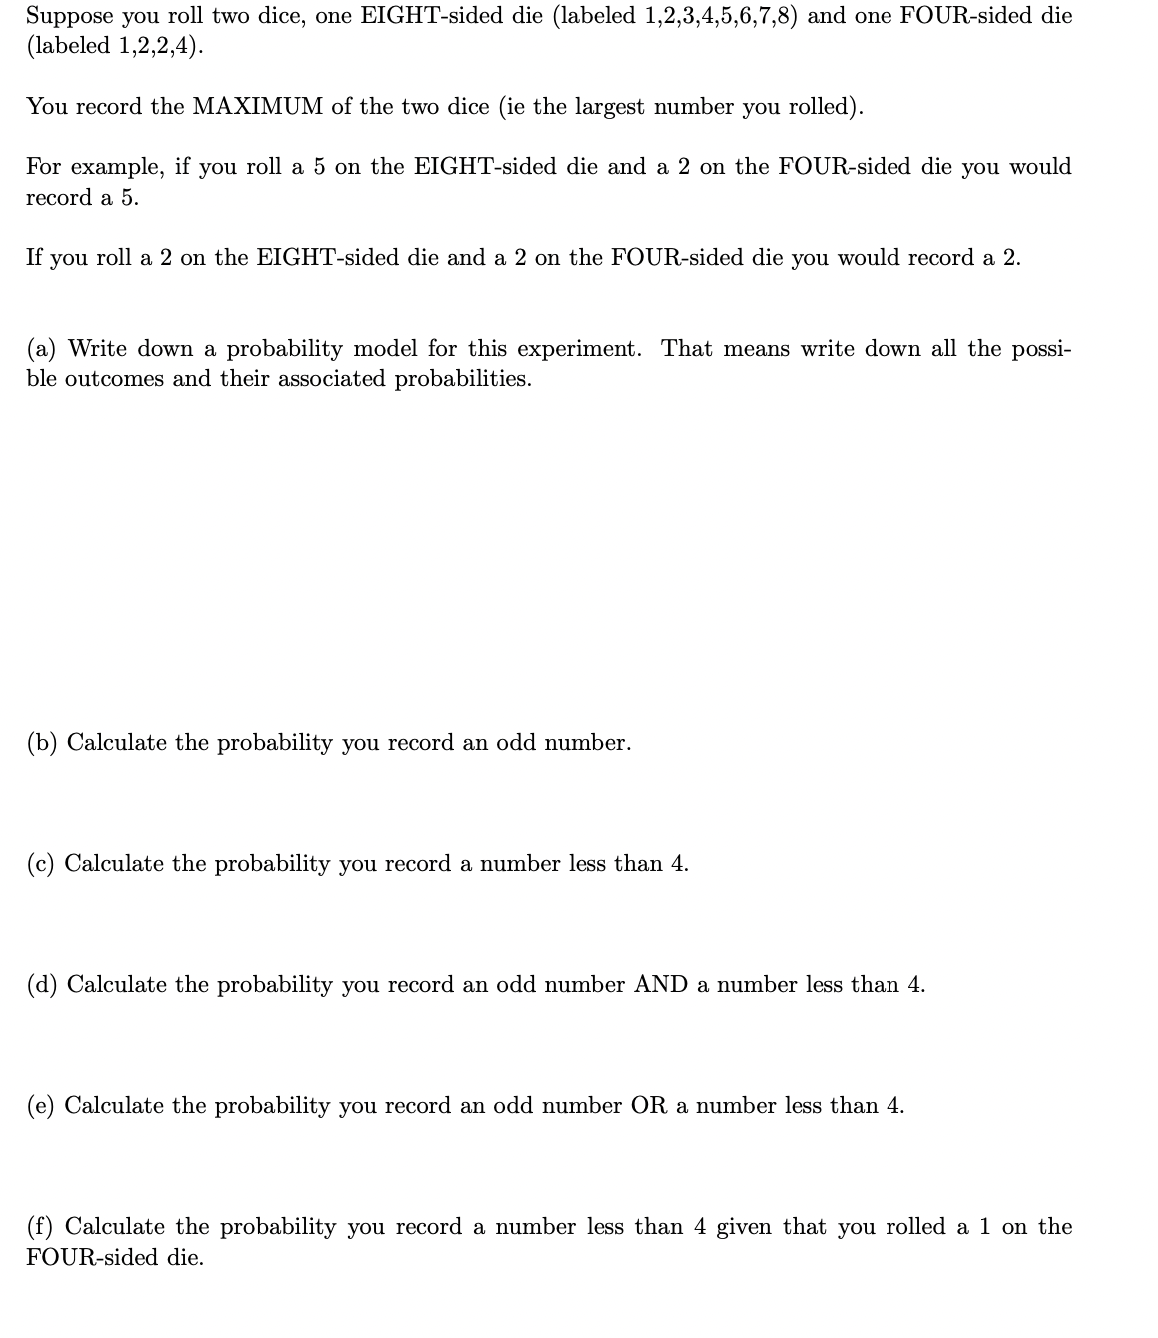

Transcribed Image Text:Suppose you roll two dice, one EIGHT-sided die (labeled 1,2,3,4,5,6,7,8) and one FOUR-sided die
(labeled 1,2,2,4).
You record the MAXIMUM of the two dice (ie the largest number you rolled).
For example, if you roll a 5 on the EIGHT-sided die and a 2 on the FOUR-sided die you would
record a 5.
If you roll a 2 on the EIGHT-sided die and a 2 on the FOUR-sided die you would record a 2.
(a) Write down a probability model for this experiment. That means write down all the possi-
ble outcomes and their associated probabilities.
(b) Calculate the probability you record an odd number.
(c) Calculate the probability you record a number less than 4.
(d) Calculate the probability you record an odd number AND a number less than 4.
(e) Calculate the probability you record an odd number OR a number less than 4.
(f) Calculate the probability you record a number less than 4 given that you rolled a 1 on the
FOUR-sided die.
Expert Solution
This question has been solved!
Explore an expertly crafted, step-by-step solution for a thorough understanding of key concepts.

This is a popular solution
Step 1: Note-
VIEW Step 2: Stating the provided information.
VIEW Step 3: Part (a) - Determine the possible outcomes and their probabilities.
VIEW Step 4: Part (b) - Determine the probability of recording an odd number
VIEW Step 5: Part (c)- Calculating the probability of recording a number less than four.
VIEW Solution
VIEW 
Trending nowThis is a popular solution!

Step by stepSolved in 6 steps with 55 images

Follow-up Questions
Read through expert solutions to related follow-up questions below.
Follow-up Question
what about D-F?
Solution
by Bartleby Expert
Follow-up Questions
Read through expert solutions to related follow-up questions below.
Follow-up Question
what about D-F?
Solution
by Bartleby Expert
Knowledge Booster

Similar questions
- Here are the top 10 season hitting percentages for members of two baseõall teams, and you must determine which is the best-hitting team, defined as the average. You have to decide which type of average you use and why. Do this by hand or use SPSS.arrow_forwardCompute P5,2.arrow_forwardIf you roll two dice, each with 8 faces, what sum is most likely to appear from the two dice? Write out each step and explain what you are doing in each step.arrow_forward
- Two diced are tossed 216 times. How many times would you expect to get a sum of 4?arrow_forwardOne common system of computing the grade point average (GPA) assigns 4 points to an A, 3 points to a B, 2 points to a C, 1 point to a D, and 0 points to an F. What is the GPA of a student who gets an A in a 3-credit course, a B in each of two 4-credit courses, a C in a 3-credit course, and a D in a 4-credit course? (Round to two decimal places) Group of answer choices 2.75 2.25 2.56 2.60arrow_forward
arrow_back_ios
arrow_forward_ios
Recommended textbooks for you
- MATLAB: An Introduction with ApplicationsStatisticsISBN:9781119256830Author:Amos GilatPublisher:John Wiley & Sons Inc
 Probability and Statistics for Engineering and th...StatisticsISBN:9781305251809Author:Jay L. DevorePublisher:Cengage Learning
 Statistics for The Behavioral Sciences (MindTap C...StatisticsISBN:9781305504912Author:Frederick J Gravetter, Larry B. WallnauPublisher:Cengage Learning
  Elementary Statistics: Picturing the World (7th E...StatisticsISBN:9780134683416Author:Ron Larson, Betsy FarberPublisher:PEARSON
 The Basic Practice of StatisticsStatisticsISBN:9781319042578Author:David S. Moore, William I. Notz, Michael A. FlignerPublisher:W. H. Freeman
 Introduction to the Practice of StatisticsStatisticsISBN:9781319013387Author:David S. Moore, George P. McCabe, Bruce A. CraigPublisher:W. H. Freeman
MATLAB: An Introduction with Applications
Statistics
ISBN:9781119256830
Author:Amos Gilat
Publisher:John Wiley & Sons Inc
Probability and Statistics for Engineering and th...
Statistics
ISBN:9781305251809
Author:Jay L. Devore
Publisher:Cengage Learning
Statistics for The Behavioral Sciences (MindTap C...
Statistics
ISBN:9781305504912
Author:Frederick J Gravetter, Larry B. Wallnau
Publisher:Cengage Learning
Elementary Statistics: Picturing the World (7th E...
Statistics
ISBN:9780134683416
Author:Ron Larson, Betsy Farber
Publisher:PEARSON
The Basic Practice of Statistics
Statistics
ISBN:9781319042578
Author:David S. Moore, William I. Notz, Michael A. Fligner
Publisher:W. H. Freeman
Introduction to the Practice of Statistics
Statistics
ISBN:9781319013387
Author:David S. Moore, George P. McCabe, Bruce A. Craig
Publisher:W. H. Freeman