
MATLAB: An Introduction with Applications
6th Edition
ISBN: 9781119256830
Author: Amos Gilat
Publisher: John Wiley & Sons Inc
expand_more
expand_more
format_list_bulleted
Related questions
Question
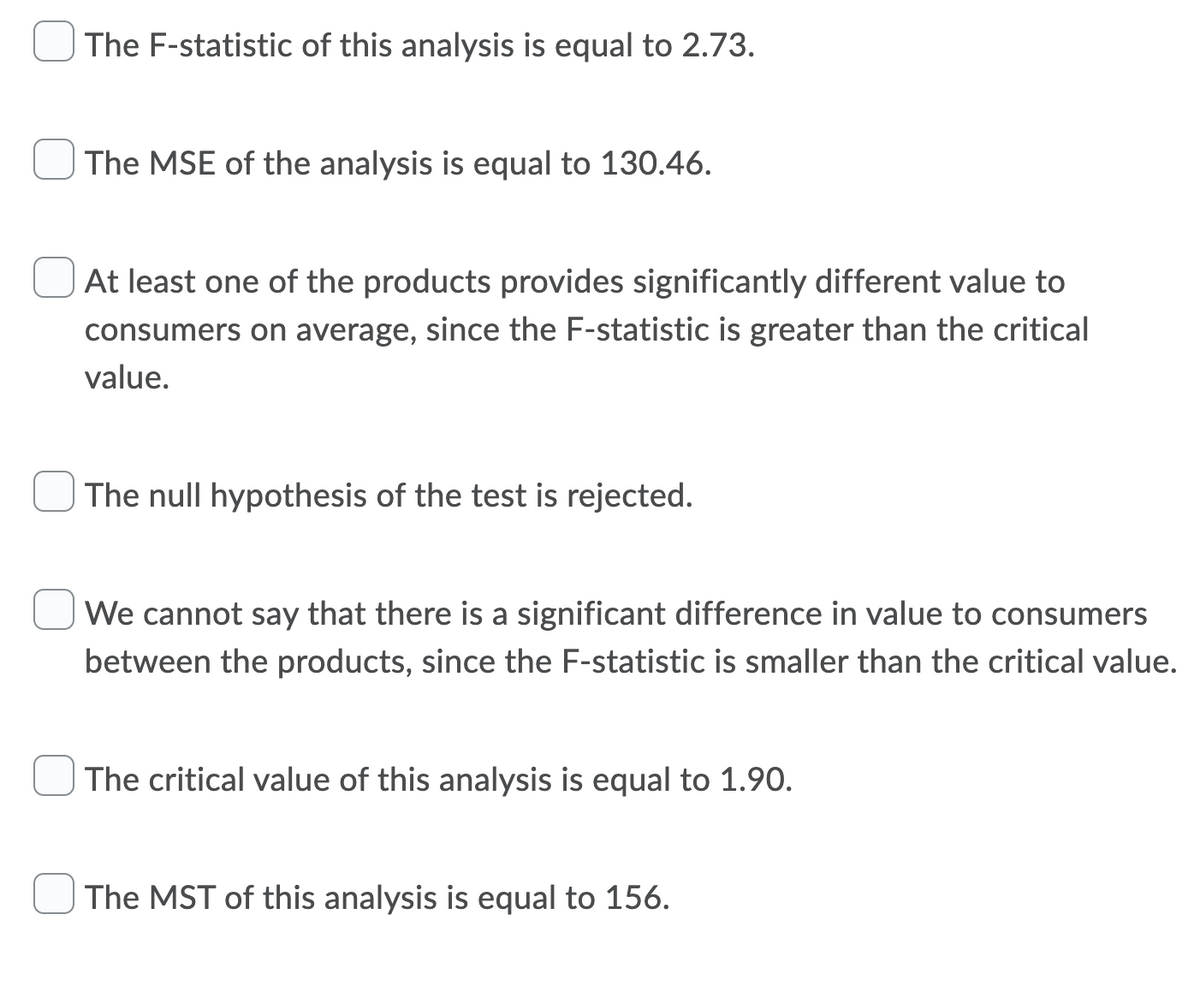

Transcribed Image Text:The F-statistic of this analysis is equal to 2.73.
The MSE of the analysis is equal to 130.46.
At least one of the products provides significantly different value to
consumers on average, since the F-statistic is greater than the critical
value.
The null hypothesis of the test is rejected.
We cannot say that there is a significant difference in value to consumers
between the products, since the F-statistic is smaller than the critical value.
The critical value of this analysis is equal to 1.90.
The MST of this analysis is equal to 156.

Transcribed Image Text:Suppose you are a manager for a local clothing store. You want to introduce a
new product for an upcoming holiday. You design 6 new products, and take a
sample of 21 customers per product design, to determine if any of the products
provide a different value to consumers through a rating system. Your one-way
ANOVA test reveals a SSTotal of 16976, along with a sum of squares between
treatments (SST) of 1321. Using this information, conduct the appropriate one-
way ANOVA test, with a significance level of 10%, to determine if any of the
products provide a significantly different value to consumers (significantly
different average rating). Select the correct results of your analysis, and if
necessary, round your answer to two decimal places. Select all choices that
apply.
Expert Solution
This question has been solved!
Explore an expertly crafted, step-by-step solution for a thorough understanding of key concepts.

Step by stepSolved in 3 steps with 1 images

Knowledge Booster

Similar questions
- Is the proportion of wildfires caused by humans in the south higher than the proportion of wildfires caused by humans in the west? 356 of the 579 randomly selected wildfires looked at in the south were caused by humans while 322 of the 597 randomly selected wildfires looked at the west were caused by humans. What can be concluded at the a = 0.01 level of significance? a. For this study, we should use z-test for the difference between two population proportions b. The null and alternative hypotheses would be: Ho: p1 p2 v (please enter a decimal) H1: p1 V p2 v (Please enter a decimal) c. The test statistic z v = 2.620 (please show your answer to 3 decimal places.) d. The p-value = 0.0213 e. The p-value is >v a f. Based on this, we should reject g. Thus, the final conclusion is that ... (Please show your answer to 4 decimal places.) |the null hypothesis. O The results are statistically significant at a = 0.01, so there is sufficient evidence to conclude that the proportion of the 579…arrow_forwardSuppose you are a manager for a local clothing store. You want to introduce a new product for an upcoming holiday. You design 8 new products, and take a sample of 16 customers per product design, to determine if any of the products provide a different value to consumers through a rating system. Your one-way ANOVA test reveals a SSTotal of 8762, along with a sum of squares between treatments (SST) of 1204. Using this information, conduct the appropriate one-way ANOVA test, with a significance level of 1%, to determine if any of the products provide a significantly different value to consumers (significantly different average rating). What is the correct result of your analysis? We cannot say that there is a significant difference in value to consumers between the products on average, since the F-statistic of the analysis is smaller than the critical value. We cannot say that there is a significant difference in value to consumers between the products on average, since the F-statistic of…arrow_forwardA sociologist is studying the age of the population in Blue Valley. Ten years ago, the population was such that 20% were under 20 years old, 14% were in the 20- to 35-year-old bracket, 30% were between 36 and 50, 24% were between 51 and 65, and 12% were over 65. A study done this year used a random sample of 210 residents. This sample is given below. At the 0.01 level of significance, has the age distribution of the population of Blue Valley changed? Under 20 20 - 35 36 - 50 51 - 65 Over 65 29 26 65 66 24 Please answer using excel A) Find the sample test statistic. (Round your answer to two decimal places.) B) Find or estimate the P-value of the sample test statistic. C) Reject or Fail to Reject the Null Hypothesisarrow_forward
- The average worker at a local brake manufacturer produces 10 brakes per day (other statistical information was not known). An industrial psychologist was hired to increase worker productivity and a new assembly method was designed and tested in a sample of workers. Identify the appropriate test. Select one: a. independent samples t test b. z test c. single sample t test d. paired samples t testarrow_forwardA union of restaurant and foodservice workers would like to estimate this year's mean hourly wage, u, of foodservice workers in the U.S. Last year's mean hourly wage was $8.25, and there is reason to believe that this year's value is less than last year's. The union decides to do a statistical test to see if the value has indeed decreased. The union chooses a random sample of this year's wages, computes the mean of the sample to be $7.98, and computes the standard deviation of the sample to be $1.25. Based on this information, answer the questions below. What are the null hypothesis (H) and the alternative hypothesis (H,) that should be used for the test? |Ho: u is ? H: u is ? v|? ? In the context of this test, what is a Type I error? v the hypothesis that u is ? A Type I error is ? fact, u is ? v when, in Suppose that the union decides not to reject the null hypothesis. What sort of error might it be making? ?arrow_forwardYou intend to conduct an ANOVA with 31 subjects, which will be divided into 3 treatment groups. (Because it will be impossible to have equal sized groups, this is referred to as an "unbalanced" single-factor ANOVA.) What are the degrees of freedom for the numerator? d.f.(treatment) = What are the degrees of freedom for the denominator? d.f.(error) =arrow_forward
- Acne is a common skin disease that affects most adolescents and can continue into adulthood. A study compared the effectiveness of three acne treatments and a placebo, all in gel form, applied twice daily for 12 weeks. The study's 517 teenage volunteers were randomly assigned to one of the four treatments. Success was assessed as clear or almost clear skin at the end of the 12 week period. The results of the study can be seen in the table below. Using the appropriate statistical test, determine if there is significant evidence that the four treatments perform differently. If so, how do they compare.arrow_forwardA sociologist is studying the age of the population in Blue Valley. Ten years ago, the population was such that 19% were under 20 years old, 14% were in the 20- to 35-year-old bracket, 33% were between 36 and 50, 23% were between 51 and 65, and 11% were over 65. A study done this year used a random sample of 210 residents. This sample is given below. At the 0.01 level of significance, has the age distribution of the population of Blue Valley changed?Under 20 20 - 35 36 - 50 51 - 65 Over 6529 27 67 65 22(i) Give the value of the level of significance. State the null and alternate hypotheses.H0: The population 10 years ago and the population today are independent.H1: The population 10 years ago and the population today are not independent.H0: The distributions for the population 10 years ago and the population today are the same.H1: The distributions for the population 10 years ago and the population today are different. H0: Time ten years ago and today are independent.H1: Time ten years…arrow_forwardYou conduct a one-factor ANOVA with 6 groups and 10 subjects in each group (a balanced design) and obtain F 2.07. Use Excel to find the requested values (report p-value accurate to 4 decimal places). betwee dfwithin p =arrow_forward
- You intend to conduct an ANOVA with 35 subjects, which will be divided into 3 treatment groups. (Because it will be impossible to have equal sized groups, this is referred to as an "unbalanced" single-factor ANOVA.)What are the degrees of freedom for the numerator?d.f.(treatment) = What are the degrees of freedom for the denominator?d.f.(error) =arrow_forwardWhat source of variation is found in an ANOVA summary table for a within subjects design that is not in an ANOVA summary table for a between subjects design. What happens to this source of variation in a between-subjects design?arrow_forwardFor a randomized block ANOVA, suppose that the treatment Factor T has four levels and the blocking Factor B has eight levels. Given that SSTR = 900, SSBL = 700, and SSE = 210, construct the randomized block ANOVA table for the data.arrow_forward
arrow_back_ios
arrow_forward_ios
Recommended textbooks for you
- MATLAB: An Introduction with ApplicationsStatisticsISBN:9781119256830Author:Amos GilatPublisher:John Wiley & Sons Inc
 Probability and Statistics for Engineering and th...StatisticsISBN:9781305251809Author:Jay L. DevorePublisher:Cengage Learning
 Statistics for The Behavioral Sciences (MindTap C...StatisticsISBN:9781305504912Author:Frederick J Gravetter, Larry B. WallnauPublisher:Cengage Learning
  Elementary Statistics: Picturing the World (7th E...StatisticsISBN:9780134683416Author:Ron Larson, Betsy FarberPublisher:PEARSON
 The Basic Practice of StatisticsStatisticsISBN:9781319042578Author:David S. Moore, William I. Notz, Michael A. FlignerPublisher:W. H. Freeman
 Introduction to the Practice of StatisticsStatisticsISBN:9781319013387Author:David S. Moore, George P. McCabe, Bruce A. CraigPublisher:W. H. Freeman
MATLAB: An Introduction with Applications
Statistics
ISBN:9781119256830
Author:Amos Gilat
Publisher:John Wiley & Sons Inc
Probability and Statistics for Engineering and th...
Statistics
ISBN:9781305251809
Author:Jay L. Devore
Publisher:Cengage Learning
Statistics for The Behavioral Sciences (MindTap C...
Statistics
ISBN:9781305504912
Author:Frederick J Gravetter, Larry B. Wallnau
Publisher:Cengage Learning
Elementary Statistics: Picturing the World (7th E...
Statistics
ISBN:9780134683416
Author:Ron Larson, Betsy Farber
Publisher:PEARSON
The Basic Practice of Statistics
Statistics
ISBN:9781319042578
Author:David S. Moore, William I. Notz, Michael A. Fligner
Publisher:W. H. Freeman
Introduction to the Practice of Statistics
Statistics
ISBN:9781319013387
Author:David S. Moore, George P. McCabe, Bruce A. Craig
Publisher:W. H. Freeman