Concept explainers
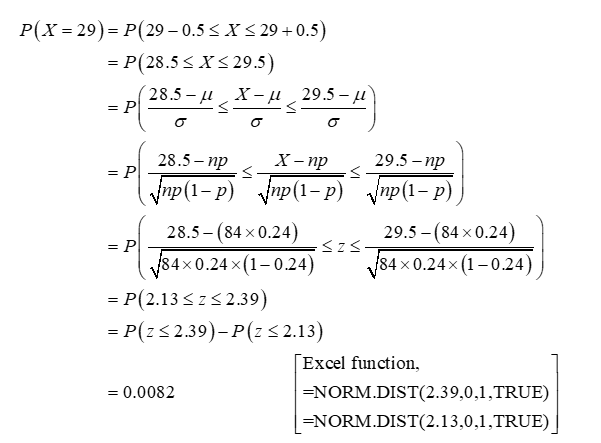
Suppose we observe 84 alcoholics with cirrhosis of the liver, of whom 29 have hepatomas—that is, liver-cell carcenoma. Suppose we know, based on a large sample, that the risk of hepatoma among alcoholics without cirrhosis of the liver is 24%.
answer the following :
1. What is the
alcoholics with cirrhosis of the liver who have hepatomas if
the true rate of hepatoma among alcoholics (with or without
cirrhosis of the liver) is .24?
2. What is the probability of observing at least 29 hepatomas among the 84 alcoholics with cirrhosis of the liver under the assumptions in Problem 1?
3. What is the smallest number of hepatomas that would have to be observed among the alcoholics with cirrhosis of the liver for the hepatoma experience in this group to differ from the hepatoma experience among alcoholics without cirrhosis of the liver? (Hint: Use a 5% probability of getting a result at least as extreme to denote differences between
the hepatoma experiences of the two groups.)
1)
From the given information, n=80 and the probability of success is p=0.24(24%).
Normal Approximation to Binomial distribution:
If the random variable X follows Binomial(n, p), then the random variable X follows normal distribution by approximating µ as np and standard deviation as square root of np(1-p).

Step by stepSolved in 2 steps with 3 images

- A manufacturer has determined that a machine averages one faulty unit for every 500 it produces. What is the probability that an order of 300 units will have one or more faulty units?arrow_forwardShow that the probability of drawing a club at random from a standard deck of 52 playing cards is the same as the probability of drawing the ace of hearts at random from a set of four cards consisting of the aces of hearts, diamonds, clubs, and spades.arrow_forwardYou draw one card at random from a standard deck of 52 playing cards. What is the probability that the card is either an ace or a spade?arrow_forward

 Holt Mcdougal Larson Pre-algebra: Student Edition...AlgebraISBN:9780547587776Author:HOLT MCDOUGALPublisher:HOLT MCDOUGAL

