Microeconomic Theory
12th Edition
ISBN: 9781337517942
Author: NICHOLSON
Publisher: Cengage
expand_more
expand_more
format_list_bulleted
Question

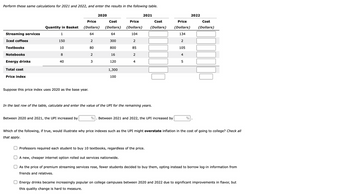
Transcribed Image Text:Perform these same calculations for 2021 and 2022, and enter the results in the following table.
Streaming services
Iced coffees
Textbooks
Notebooks
Energy drinks
Total cost
Price index
Price
Quantity in Basket (Dollars)
1
64
150
2
10
80
8
2
40
3
Suppose this price index uses 2020 as the base year.
2020
Between 2020 and 2021, the UPI increased by
Cost
(Dollars)
64
300
800
16
120
1,300
100
Price
(Dollars)
104
2
85
2
4
2021
Cost
(Dollars)
In the last row of the table, calculate and enter the value of the UPI for the remaining years.
% Between 2021 and 2022, the UPI increased by
Price
Cost
(Dollars) (Dollars)
134
2
105
4
5
2022
%
Which of the following, if true, would illustrate why price indexes such as the UPI might overstate inflation in the cost of going to college? Check all
that apply.
Professors required each student to buy 10 textbooks, regardless of the price.
A new, cheaper internet option rolled out services nationwide.
As the price of premium streaming services rose, fewer students decided to buy them, opting instead to borrow log-in information from
friends and relatives.
Energy drinks became increasingly popular on college campuses between 2020 and 2022 due to significant improvements in flavor, but
this quality change is hard to measure.

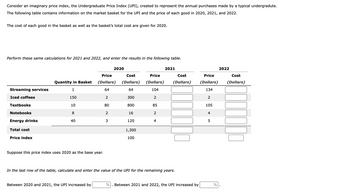
Transcribed Image Text:Consider an imaginary price index, the Undergraduate Price Index (UPI), created to represent the annual purchases made by a typical undergradute.
The following table contains information on the market basket for the UPI and the price of each good in 2020, 2021, and 2022.
The cost of each good in the basket as well as the basket's total cost are given for 2020.
Perform these same calculations for 2021 and 2022, and enter the results in the following table.
Streaming services
Iced coffees
Textbooks
Notebooks
Energy drinks
Total cost
Price index
Quantity in Basket
1
150
10
8
40
Suppose this price index uses 2020 as the base year.
Price
(Dollars)
64
Between 2020 and 2021, the UPI increased by
2020
2
80
2
3
Cost
(Dollars)
64
300
800
16
120
1,300
100
Price
(Dollars)
104
2
85
2
4
2021
Cost
(Dollars)
In the last row of the table, calculate and enter the value of the UPI for the remaining years.
% Between 2021 and 2022, the UPI increased by
Price
(Dollars)
134
2
105
4
5
%
2022
Cost
(Dollars)
Expert Solution
arrow_forward
Step 1
A price index measures the change in price of basket of goods relative to the base year.
i.e., Price index = (Cost of basket of goods at current year price / Cost of basket of goods at base year price)*100
--------------
The percentage change in price index measures the inflation rate.
---------------
Undergraduate Price Index (UPI) is an imaginary price index which represents the annual purchase made by a typical undergraduate.
---------------
Trending nowThis is a popular solution!
Step by stepSolved in 4 steps with 1 images

Knowledge Booster
Learn more about
Need a deep-dive on the concept behind this application? Look no further. Learn more about this topic, economics and related others by exploring similar questions and additional content below.Similar questions
- A government scholarship program would be designed to shift the curve to the .arrow_forwardAgis Homes is one of the largest builders of new homes in the U.S. As the economist for Agis Homes, you have forecast the following for the year 2022: The price of lumber used to construct homes will increase by 25% The economy will come roaring back and personal income will increase by close to 10% Assume that the prices of new homes are determined by supply and demand. Assuming everything else is held constant: If both of these impacts occur at the same time, what do you expect to happen to the equilibrium price and quantity of new homes? Use demand and supply analysis to help explain your answer.arrow_forwardThe following graph input tool shows the daily demand for hotel rooms at the Big Winner Hotel and Casino in Las Vegas, Nevada. To help the hotel management better understand the market, an economist identified three primary factors that affect the demand for rooms each night. These demand factors, along with the values corresponding to the initial demand curve, are shown in the following table and alongside the graph input tool. Demand Factor Initial Value Average American household income $50,000 per year Roundtrip airfare from San Francisco (SFO) to Las Vegas (LAS) $250 per roundtrip Room rate at the Lucky Hotel and Casino, which is near the Big Winner $200 per night Use the graph input tool to help you answer the following questions. You will not be graded on any changes you make to this graph.arrow_forward
- The following graph input tool shows the daily demand for hotel rooms at the Big Winner Hotel and Casino in Las Vegas, Nevada. To help the hotel management better understand the market, an economist identified three primary factors that affect the demand for rooms each night. These demand factors, along with the values corresponding to the initial demand curve, are shown in the following table and alongside the graph input tool. Demand Factor Initial Value Average American household income $40,000 per year Roundtrip airfare from New York (JFK) to Las Vegas (LAS) $250 per roundtrip Room rate at the Lucky Hotel and Casino, which is near the Big Winner $250 per night Use the graph input tool to help you answer the following questions. You will not be graded on any changes you make to this graph. Note: Once you enter a value in a white field, the graph and any corresponding amounts in each grey field will change accordingly.arrow_forwardThe following graph input tool shows the daily demand for hotel rooms at the Big Winner Hotel and Casino in Las Vegas, Nevada. To help the hotel management better understand the market, an economist identified three primary factors that affect the demand for rooms each night. These demand factors, along with the values corresponding to the initial demand curve, are shown in the following table and alongside the graph input tool. Demand Factor Initial Value Average American household income $40,000 per year Roundtrip airfare from New York (JFK) to Las Vegas (LAS) $250 per roundtrip Room rate at the Lucky Hotel and Casino, which is near the Big Winner $250 per night Use the graph input tool to help you answer the following questions. You will not be graded on any changes you make to this graph. Note: Once you enter a value in a white field, the graph and any corresponding amounts in each grey field will change accordingly. For each of the following scenarios, begin…arrow_forwardDon’t know how to solvearrow_forward
- The following graph input tool shows the daily demand for hotel rooms at the Peacock Hotel and Casino in Las Vegas, Nevada. To help the hotel management better understand the market, an economist identified three primary factors that affect the demand for rooms each night. These demand factors, along with the values corresponding to the initial demand curve, are shown in the following table and alongside the graph input tool. Demand Factor Initial Value Average American household income $40,000 per year Roundtrip airfare from New York (JFK) to Las Vegas (LAS) $200 per roundtrip $250 per night Room rate at the Grandiose Hotel and Casino, which is near the Peacock Use the graph input tool to help you answer the following questions. You will not be graded on any changes you make to this graph. Note: Once you enter a value in a white field, the graph and any corresponding amounts in each grey field will change accordingly. Graph Input Tool (?) Market for Peacock's Hotel Rooms 500 Price 350…arrow_forwardGraph Input Tool Market for Peacock's Hotel Rooms 500 450 I Price (Dollars per room) 350 400 Quantity Demanded (Hotel rooms per night) 150 350 300 250 Demand Factors 200 150 Average Income (Thousands of dollars) Demand 40 100 Airfare from JFK to LAS (Dollars per roundtrip) 50 + 200 50 100 150 200 250 300 350 400 450 500 Room Rate at Grandiose (Dollars per night) QUANTITY (Hotel rooms) 250 For each of the following scenarios, begin by assuming that all demand factors are set to their original values and Peacock is charging $350 per room per night. If average household income increases by 50%, from $40,000 to $60,000 per year, the quantity of rooms demanded at the Peacock from rooms per night to |rooms per night. Therefore, the income elasticity of demand is , meaning that hotel rooms at the Peacock are If the price of a room at the Grandiose were to decrease by 10%, from $250 to $225, while all other demand factors remain at their initial values, the quantity of rooms demanded at the…arrow_forwardThe following graph input tool shows the daily demand for hotel rooms at the Lakes Hotel and Casino in Atlantic City, New Jersey. To help the hotel management better understand the market, an economist identified three primary factors that affect the demand for rooms each night. These demand factors, along with the values corresponding to the initial demand curve, are shown in the following table and alongside the graph input tool. Demand Factor Average American household income Roundtrip airfare from New Orleans (MSY) to Atlantic City (ACY) Room rate at the Mountaineer Hotel and Casino, which is near the Lakes Initial Value $40,000 per year $250 per roundtrip $250 per night Use the graph input tool to help you answer the following questions. You will not be graded on any changes you make to this graph. Note: Once you enter a value in a white field, the graph and any corresponding amounts in each grey field will change accordingly. PRICE (Dollars per room) 500 450 400 350 300 250 200…arrow_forward
- The following graph input tool shows the daily demand for hotel rooms at the Oceans Hotel and Casino in Atlantic City, New Jersey. To help the hotel management better understand the market, an economist identified three primary factors that affect the demand for rooms each night. These demand factors, along with the values corresponding to the initial demand curve, are shown in the following table and alongside the graph input tool. Demand Factor Initial Value Average American household income $50,000 per year Roundtrip airfare from New Orleans (MSY) to Atlantic City (ACY) $200 per roundtrip Room rate at the Meadows Hotel and Casino, which is near the Oceans $200 per night Use the graph input tool to help you answer the following questions. You will not be graded on any changes you make to this graph.arrow_forwardDon’t know what steps to take to be able to solve correctlyarrow_forwardMarket equilibrium and disequilibrium The following graph shows the monthly demand and supply curves in the market for keyboards. Use the graph input tool to help you answer the following questions. You will not be graded on any changes you make to this graph. Note: Once you enter a value in a white field, the graph and any corresponding amounts in each grey field will change accordingly. 05010015020025030035040045050080726456484032241680PRICE (Dollars per keyboard)QUANTITY (Keyboards)Demand Supply Graph Input Tool Market for Keyboards Price (Dollars per keyboard) Quantity Demanded (Keyboards) Quantity Supplied (Keyboards) The equilibrium price in this market is per keyboard, and the equilibrium quantity is keyboards bought and sold per month. Complete the following table by indicating at each price whether there is a shortage or surplus in the market, the amount of that shortage or surplus, and…arrow_forward
arrow_back_ios
SEE MORE QUESTIONS
arrow_forward_ios
Recommended textbooks for you
