
ENGR.ECONOMIC ANALYSIS
14th Edition
ISBN: 9780190931919
Author: NEWNAN
Publisher: Oxford University Press
expand_more
expand_more
format_list_bulleted
Related questions
Question
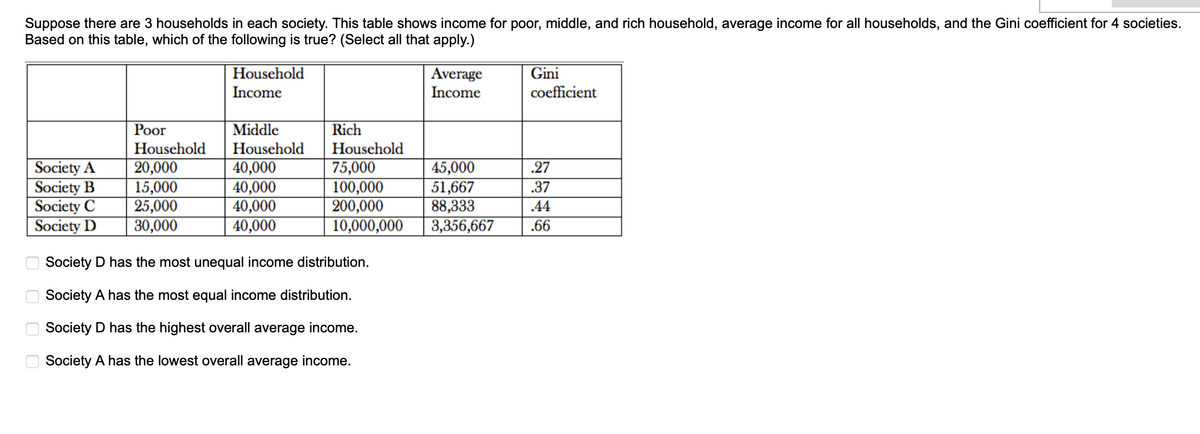

Transcribed Image Text:Suppose there are 3 households in each society. This table shows income for poor, middle, and rich household, average income for all households, and the Gini coefficient for 4 societies.
Based on this table, which of the following is true? (Select all that apply.)
Society A
Society B
Society C
Society D
оооо
Household
Income
Poor
Middle
Household Household
20,000
15,000
25,000
30,000
40,000
40,000
40,000
40,000
Rich
Household
75,000
100,000
200,000
10,000,000
Society D has the most unequal income distribution.
Society A has the most equal income distribution.
Society D has the highest overall average income.
Society A has the lowest overall average income.
Average
Income
45,000
51,667
88,333
3,356,667
Gini
coefficient
.27
.37
.44
.66
Expert Solution
This question has been solved!
Explore an expertly crafted, step-by-step solution for a thorough understanding of key concepts.

This is a popular solution

Trending nowThis is a popular solution!

Step by stepSolved in 3 steps

Knowledge Booster


Learn more about
Need a deep-dive on the concept behind this application? Look no further. Learn more about this topic, economics and related others by exploring similar questions and additional content below.Similar questions
- 20.7 Essay: How Economic Inequality Arises 1) What is "human capital" and why is it considered an investment? 2) What is "human capital"? How is it important in the determination of a worker's wage rate? 3) How is human capital acquired? 4) How does the demand for high-skilled workers compare to the demand for low-skilled workers? Why does this difference exist? 5) How does an increase in the cost to acquire a skill affect the vertical distance between the supply curves of high-skilled and low-skilled workers?arrow_forwardThe $1.4 billion trick to make us accept income inequality Lotteries take money from the poor and redistribute it unequally. The poor, the uneducated, and minorities play the lottery the most, and it takes a big chunk of their income Source: The Huffington Post, January 12, 2016 If the news clip is correct, how does a lottery change the distribution of income? Draw two Lorenz curves to illustrate your answer. Lotteries result in the distribution of income Draw the Lorenz curve in a country that does not have lotteries. Label it Before Draw the Lorenz curve for the country after the introduction of lotteries. Label it After >>> To reposition the label click on the cross by the label box and dragging it 100 80 60 40- 20 Cumulative percentage of income 100 20 40 60 00 Cumulative percentage of households >>>Draw only the objects specified in the question Garrow_forward1. relative or absolute 2. relative or absolute 3. little or substantial 4.relative or absolute 5. Supplemental or Social 6.Supplemental or Social 7. earned income or dependent care 8. Disability or Nutrition Only typed answerarrow_forward
- Suppose the teacher for your course, "Principles of Economics" is a libertarian and adheres strictly by its principles in running your economics class. What policies would you expect your teacher to institute? Policies a Libertarian Would Enforce Policies a Libertarian Would Not Enforce The teacher, seeing grade inequality, decides to give points from the best student's test to the worst's students test. The teacher decides to give everyone in the class an A. The teacher punishing a student for cheating on her income equality and poverty homework assignment. Grade the class on a curve to ensure even grade distribution. When proctoring a test, your teacher requires all students to be given the test face down and all turn over your tests at the same time so that no one has a time advantage.arrow_forwardPart B: Briefly provide three reasons as to why income inequality is on the rise in Canada and the US. Secondly, briefly explain how our respective tax systems can help reduce income inequality (be specific about the type of tax you are referring to).arrow_forwardUse the data from the table below to construct a Lorenz curve. Income Shares in the United States Lowest 20% Second Lowest 20% Third 20% Fourth 20% Highest 20% 5.2 10.3 15.3 22.4 46.9arrow_forward
arrow_back_ios
arrow_forward_ios
Recommended textbooks for you
 Principles of Economics (12th Edition)EconomicsISBN:9780134078779Author:Karl E. Case, Ray C. Fair, Sharon E. OsterPublisher:PEARSON
 Engineering Economy (17th Edition)EconomicsISBN:9780134870069Author:William G. Sullivan, Elin M. Wicks, C. Patrick KoellingPublisher:PEARSON
 Principles of Economics (MindTap Course List)EconomicsISBN:9781305585126Author:N. Gregory MankiwPublisher:Cengage Learning
 Managerial Economics: A Problem Solving ApproachEconomicsISBN:9781337106665Author:Luke M. Froeb, Brian T. McCann, Michael R. Ward, Mike ShorPublisher:Cengage Learning
 Managerial Economics & Business Strategy (Mcgraw-...EconomicsISBN:9781259290619Author:Michael Baye, Jeff PrincePublisher:McGraw-Hill Education
Principles of Economics (12th Edition)
Economics
ISBN:9780134078779
Author:Karl E. Case, Ray C. Fair, Sharon E. Oster
Publisher:PEARSON
Engineering Economy (17th Edition)
Economics
ISBN:9780134870069
Author:William G. Sullivan, Elin M. Wicks, C. Patrick Koelling
Publisher:PEARSON
Principles of Economics (MindTap Course List)
Economics
ISBN:9781305585126
Author:N. Gregory Mankiw
Publisher:Cengage Learning
Managerial Economics: A Problem Solving Approach
Economics
ISBN:9781337106665
Author:Luke M. Froeb, Brian T. McCann, Michael R. Ward, Mike Shor
Publisher:Cengage Learning
Managerial Economics & Business Strategy (Mcgraw-...
Economics
ISBN:9781259290619
Author:Michael Baye, Jeff Prince
Publisher:McGraw-Hill Education