
MATLAB: An Introduction with Applications
6th Edition
ISBN: 9781119256830
Author: Amos Gilat
Publisher: John Wiley & Sons Inc
expand_more
expand_more
format_list_bulleted
Related questions
Question
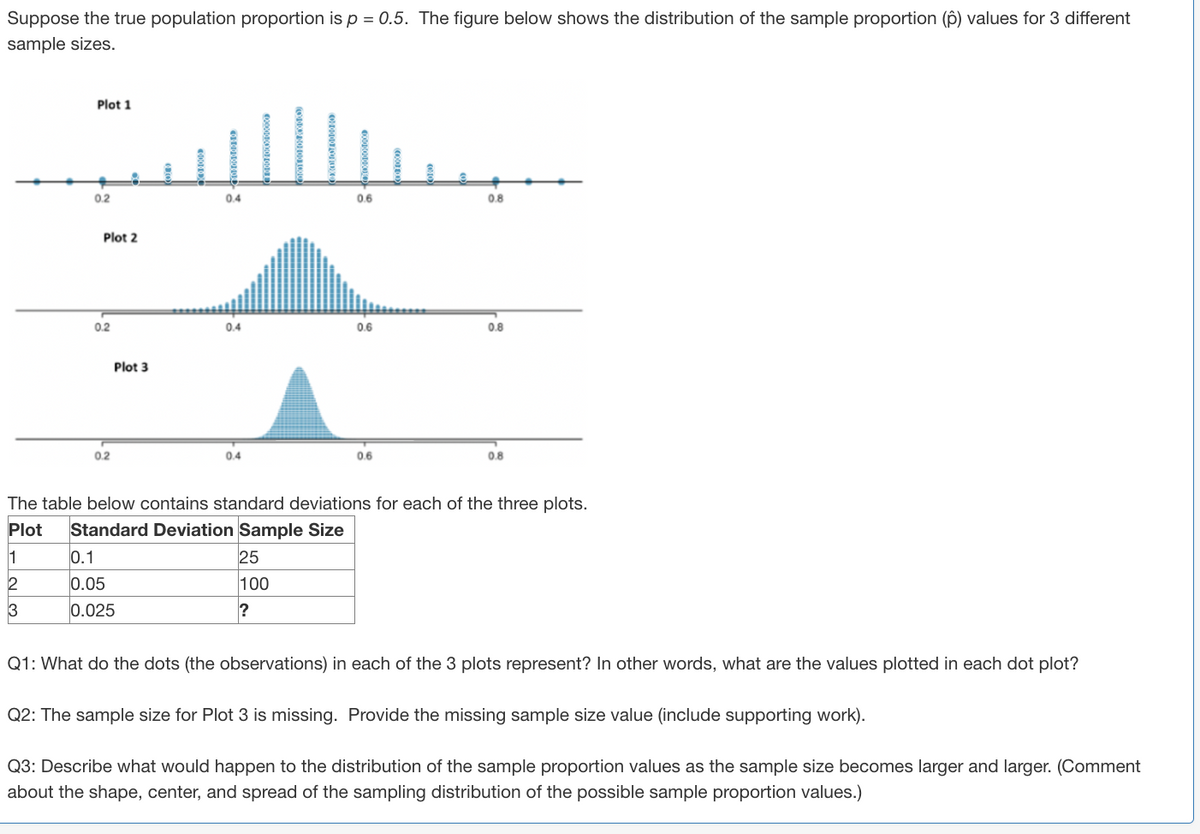

Transcribed Image Text:Suppose the true population proportion is p = 0.5. The figure below shows the distribution of the sample proportion (p) values for 3 different
sample sizes.
Plot 1
1
2
3
+
0.2
Plot 2
0.2
0.2
Plot 3
0.4
0.1
0.05
0.025
0.4
0.4
COODOODONTO
25
100
?
0.6
0.6
0.6
0.8
The table below contains standard deviations for each of the three plots.
Plot Standard Deviation Sample Size
0.8
0.8
Q1: What do the dots (the observations) in each of the 3 plots represent? In other words, what are the values plotted in each dot plot?
Q2: The sample size for Plot 3 is missing. Provide the missing sample size value (include supporting work).
Q3: Describe what would happen to the distribution of the sample proportion values as the sample size becomes larger and larger. (Comment
about the shape, center, and spread of the sampling distribution of the possible sample proportion values.)
Expert Solution
This question has been solved!
Explore an expertly crafted, step-by-step solution for a thorough understanding of key concepts.

This is a popular solution

Trending nowThis is a popular solution!

Step by stepSolved in 2 steps with 1 images

Knowledge Booster

Similar questions
- Listed below are the top 10 annual salaries (in millions of dollars) of TV personalities. Find the range, variance, and standard deviation for the sample data. Given that these are the top 10 salaries, do we know anything about the variation of salaries of TV personalities in general? 39 37 35 27 15 11 9 7 6.8 6.3arrow_forwardYou want to see if the average grade for nontraditional age students is less than the average grade for traditional age students. You believe both populations are normally distributed, but you do not know the standard deviations for either. You obtain the following two samples of data. Non-Traditional Age Students Traditional Age Students 53.9 87 102.9 99.8 44.1 63.9 72.6 87.5 70.2 100.8 88.7 114.4 46.9 54.7 83.4 101.4 38 108.9 53.1 88 29.5 121.5 117.5 74.3 79.8 105.2 86.8 94.1 88.1 92.7 77.3 93.2 44.1 98.4 74.4 114.4 72.6 75.8 29.5 88 42.4 105.8 48.2 108.9 68.7 92.7 90.8 97.4 85.7 97.4 62.5 135.7 Use a significance level of 0.050.05 to answer the following. What is the test statistic for this sample? (Report answer accurate to three decimal places.)t-test statistic = What is the p-value for this sample? (Report answer accurate to four decimal places.)p-value =arrow_forwardListed below are the amounts (dollars) it costs for marriage proposal packages at different baseball stadiums. Find the range, variance, and standard deviation for the given sample data. Include appropriate units in the results. Are there any outliers, and are they likely to have much of an effect on the measures of variation? 35 45 50 55 65 75 90 170 195 207 250 325 400 1750 3000 The range of the sample data is (Type an integer or a decimal. Do not round.)arrow_forward
- Listed below are the numbers of hurricanes that occurred in each year in a certain region. The data are listed in order by year. Find the range, variance, and standard deviation for the given sample data. Include appropriate units in the results. What important feature of the data is not revealed by any of the measures of variation? 19 14 9 3 10 15 20 4 10 20 14 6 16 13 The range of the sample data is nothing ▼ years.years. hurricanes squared .hurricanes2. years squared .years2. hurricanes.arrow_forwardListed below are the top 10 annual salaries (in millions of dollars) of TV personalities. Find the range, variance, and standard deviation for the sample data. Given that these are the top 10 salaries, do we know anything about the variation of salaries of TV personalities in general? 38 37 35 28 18 15 13 12 11.6 10.7arrow_forwardConsider the following sample data. Sample A: Sample B: Sample C: 3, 7, 11 74, 78, 82 1,065; 1,069; 1,073 (a) Find the mean and standard deviation for each sample. Sample A Sample B Sample C Mean Sample Standard Deviation (b) What does this exercise show about the standard deviation? O The idea is to illustrate that the standard deviation is not a function of the value of the mean. O The idea is to illustrate that the standard deviation is a function of the value of the mean, ere to search O Aiarrow_forward
- A primary measure of dispersion for sample data is the sample standard deviation, s. Choose the best option to explain what the meaning of the sample standard deviation is, in general. A. The distance between one observation and the mean. B. The average distance of an observation from the middle of the distribution. C. The average distance between observations in the sample. D. The distance between the third and first quartiles.arrow_forwardCalculate the range, variance , and stanard deviation for the following a.4,2,1,0,1 b.1,6,2,2,3,0,3 c.8,-2,1,3,5,4,4,1,3 d.0,2,0,0,-1,1,-2,1,0,-1,0,-3,-2,-1,0,1arrow_forwardAn insurance company is looking over accident statistics. They want to model the population of all drivers for the population parameter of the standard deviation and variance of the age of the driver involved in an automobile accident. They have a sample of 100 accidents from around the country. The age of the driver in each of these accidents is provided below. Use Excel to calculate the sample standard deviation and the sample variance. Round your answers to one decimal place. Do not round until you've calculated your final answer "Age of people in accident"48643346436728189044472440202747683248472248217347302918487364454920205066654187873417203176493089672222455023481746382942254720463119214227226621236675744621461969202048238851284918204522313823284939 Standard deviation: Variance:arrow_forward
- We are going to calculate the standard deviation for the following set of sample data by hand. Round all values to 4 decimal places where possible. Note: on the exam you can use the calculator function. The data are: 6,7,6, 15, 15 a) Calculate the mean. x = b) Fill in the table. x x-x (x-x)² 6 7 6 15 15 Total c) Calculate the standard deviation. Standard deviation: S= Σ(α - π)2 n-1 S =arrow_forwardA sample consists of the following N scores 1,9,8,5,7 calculate the standard deviationarrow_forwardConsider the following sample data. Sample A: 5, 8, 11 Sample B: 64, 67, 70 Sample C: 1,015; 1,018; 1,021 (a) Find the mean and standard deviation for each sample. (b) What does this exercise show about the standard deviation? multiple choice The idea is to illustrate that the standard deviation is not a function of the value of the mean. The idea is to illustrate that the standard deviation is a function of the value of the mean.arrow_forward
arrow_back_ios
SEE MORE QUESTIONS
arrow_forward_ios
Recommended textbooks for you
- MATLAB: An Introduction with ApplicationsStatisticsISBN:9781119256830Author:Amos GilatPublisher:John Wiley & Sons Inc
 Probability and Statistics for Engineering and th...StatisticsISBN:9781305251809Author:Jay L. DevorePublisher:Cengage Learning
 Statistics for The Behavioral Sciences (MindTap C...StatisticsISBN:9781305504912Author:Frederick J Gravetter, Larry B. WallnauPublisher:Cengage Learning
  Elementary Statistics: Picturing the World (7th E...StatisticsISBN:9780134683416Author:Ron Larson, Betsy FarberPublisher:PEARSON
 The Basic Practice of StatisticsStatisticsISBN:9781319042578Author:David S. Moore, William I. Notz, Michael A. FlignerPublisher:W. H. Freeman
 Introduction to the Practice of StatisticsStatisticsISBN:9781319013387Author:David S. Moore, George P. McCabe, Bruce A. CraigPublisher:W. H. Freeman
MATLAB: An Introduction with Applications
Statistics
ISBN:9781119256830
Author:Amos Gilat
Publisher:John Wiley & Sons Inc
Probability and Statistics for Engineering and th...
Statistics
ISBN:9781305251809
Author:Jay L. Devore
Publisher:Cengage Learning
Statistics for The Behavioral Sciences (MindTap C...
Statistics
ISBN:9781305504912
Author:Frederick J Gravetter, Larry B. Wallnau
Publisher:Cengage Learning
Elementary Statistics: Picturing the World (7th E...
Statistics
ISBN:9780134683416
Author:Ron Larson, Betsy Farber
Publisher:PEARSON
The Basic Practice of Statistics
Statistics
ISBN:9781319042578
Author:David S. Moore, William I. Notz, Michael A. Fligner
Publisher:W. H. Freeman
Introduction to the Practice of Statistics
Statistics
ISBN:9781319013387
Author:David S. Moore, George P. McCabe, Bruce A. Craig
Publisher:W. H. Freeman