
MATLAB: An Introduction with Applications
6th Edition
ISBN: 9781119256830
Author: Amos Gilat
Publisher: John Wiley & Sons Inc
expand_more
expand_more
format_list_bulleted
Related questions
Question
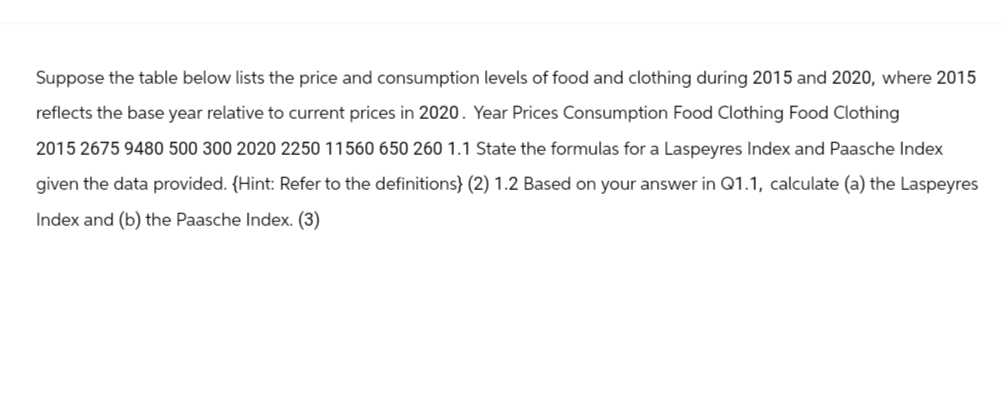

Transcribed Image Text:Suppose the table below lists the price and consumption levels of food and clothing during 2015 and 2020, where 2015
reflects the base year relative to current prices in 2020. Year Prices Consumption Food Clothing Food Clothing
2015 2675 9480 500 300 2020 2250 11560 650 260 1.1 State the formulas for a Laspeyres Index and Paasche Index
given the data provided. (Hint: Refer to the definitions} (2) 1.2 Based on your answer in Q1.1, calculate (a) the Laspeyres
Index and (b) the Paasche Index. (3)
Expert Solution
This question has been solved!
Explore an expertly crafted, step-by-step solution for a thorough understanding of key concepts.

Step by stepSolved in 4 steps

Knowledge Booster

Similar questions
- B4. A company has collected and smoothened its historcal yearly sales data of a product from 2015 up to 2021. The following table shows the sales and moving average figures. Year Sales Three-year moving average Five-ycar moving average (S thousands) 2015 2016 326.0 324.0 E 367.4 2017 344.0 2018 383.0 371.0 E 2019 389.0 2020 398.0 D. 2021 428.0 Calculate the missing values of 4, B, C, D, E and F(Correct to I decimal place).arrow_forwardI need help please soon as possiblearrow_forwardThe total amount of consumer credit has been increasing steadily in recent years. The following table gives the total outstanding consumer credit (in billions of dollars). Answer parts (a) through (e) below Year 2004 2005 2006 2007 2008 Consumer Credit 2250.5 2303.8 2415.0 2517.9 2595.1 Year 2009 2010 2011 2012 2013 Consumer Credit 2551.5 2645.1 2757.0 2926 3 3099 2 a. Find an equation for the least squares line, letting x equal the number of years since 2000. The equation is Y=x (Use integers or decimals for any numbers in the equation Round to two decimal places as needed.)arrow_forward
- I'm running out of questions. Can I pay for 30 more extra?arrow_forwardThe numbers of polio cases in the world are shown in the table for various years. Year Number of Polio Cases (thousands) 1988 1992 1996 2000 2005 2007 350 138 32 6 3.2 1.3 Let f(t) be the number of polio cases (in thousands) t years after 1980. Copy the data to Desmos to draw a scatterplot of the data. Make sure to adjust the years so they represent years after 1980. a) Is it better to model the data with a linear or with an exponential model? Select an answer b) Use regression in Desmos to find an appropriate model for f. Make sure to check Log mode in the parameter window in Desmos if you are fitting an exponential model. f(t) places. Round the coefficients to 4 decimal Hint: Use the variable t from the drop down menu when entering the equation. Do not just type in t. c) Predict the number of polio cases in 2019. d) Find the approximate half-life of the number of polio cases. Round the answer to one decimal place. yearsarrow_forwardC8. According to the Pew Research Center (2015), recent immigrants are better educated than earlier immigrants to the United States. The change was attributed to the availability of better education in each region or country of origin. The percentage of immigrants 25 years of age and older who completed at least high school is reported in this table for 1970 to 2013. Write a statement describing the change over time in the percentage who completed at least a high school degree. 1970 1980 1990 2000 2013 Mexico 14 17 26 30 48 Other Central/South America 57 53 60 66 Asia 75 72 75 82 84 48 68 81 87 95 Europe 36 48 52 58 72 Caribbean 81 91 88 85 85 Africa Source: Pew Research Center, Modern Immigration Wave Brings 59 Million to U.S., Driving Population Growth and Change Through 2065, 2015. Retrieved from https://www.pewresearch.org/hispanic/2015/09/28/modern- immigration-wave-brings-59-million-to-u-s-driving-population-growth-and-change-through-2065/ 52arrow_forward
- Below is data collected over 6 specific years. The data collected is the Consumer Price Index (CPI) and the cost of a slice of tuna. We would like to build a model using the CPI to predict the cost of a slice of pizza in a given year. Year 1960 1973 1986 1995 2002 2003 CPI (x) 30.2 48.3 112.3 162.2 191.9 197.8 Cost of a slice of tuna(y) 0.15 0.35 1.00 1.25 1.75 2.00 Plot the data. Are we justified in creating a Linear Regression model to predict the price of a pizza slice using the CPI? Why or why not? Calculate the descriptive statistics. Calculate the sums of squares Calculate the slope, intercept, and correlation. What is this correlation value telling us? Assemble the prediction equation, and interpret the slope within the context of the problem. State the hypotheses for the hypothesis test for regression.arrow_forward2. Which of the following statements is false? Explain your answer. A. A price index can be used to compare changes in prices over time. B. A graph of the average monthly price of gas is an example of an index. C. Price index values are often calculated relative to a base value at a certain point in time or in a certain place. D. Index values can be greater than 100.arrow_forwardis this correct?arrow_forward
- The numbers of polio cases in the world are shown in the table for various years. Year Number of Polio Cases (thousands) 1988 1992 1996 2000 2005 2007 350 138 33 3 3.2 1.3 Let f(t) be the number of polio cases (in thousands) t years after 1980. Copy the data to Desmos to draw a scatterplot of the data. Make sure to adjust the years so they represent years after 1980. a) Is it better to model the data with a linear or with an exponential model? [Select an answer b) Use regression in Desmos to find an appropriate model for f. Make sure to check Log mode in the parameter window in Desmos if you are fitting an exponential model. f(t) Round the coefficients to 4 decimal places. Hint: Use the variablet from the drop down menu when entering the equation. Do not just type in t. c) Predict the number of polio cases in 2013. d) Find the approximate half-life of the number of polio cases. Round the answer to one decimal place. yearsarrow_forwardShowing by using excel format, please solve the following:arrow_forwardkln 2.18 The report "Trends in Education 2010: Community Colleges" (www.collegeboard.com/trends) included the accompanying information on student debt for students graduating with an AA degree from a public community college in 2008. Debt Relative Frequency None 0.62 Less than $10,000 0.23 Between $10,000 and $20,000 0.10 More than $20,000 0.05 a. Use the given information to construct a bar chart. b. Comment on student debt for public community college graduates.arrow_forward
arrow_back_ios
arrow_forward_ios
Recommended textbooks for you
- MATLAB: An Introduction with ApplicationsStatisticsISBN:9781119256830Author:Amos GilatPublisher:John Wiley & Sons Inc
 Probability and Statistics for Engineering and th...StatisticsISBN:9781305251809Author:Jay L. DevorePublisher:Cengage Learning
 Statistics for The Behavioral Sciences (MindTap C...StatisticsISBN:9781305504912Author:Frederick J Gravetter, Larry B. WallnauPublisher:Cengage Learning
  Elementary Statistics: Picturing the World (7th E...StatisticsISBN:9780134683416Author:Ron Larson, Betsy FarberPublisher:PEARSON
 The Basic Practice of StatisticsStatisticsISBN:9781319042578Author:David S. Moore, William I. Notz, Michael A. FlignerPublisher:W. H. Freeman
 Introduction to the Practice of StatisticsStatisticsISBN:9781319013387Author:David S. Moore, George P. McCabe, Bruce A. CraigPublisher:W. H. Freeman
MATLAB: An Introduction with Applications
Statistics
ISBN:9781119256830
Author:Amos Gilat
Publisher:John Wiley & Sons Inc
Probability and Statistics for Engineering and th...
Statistics
ISBN:9781305251809
Author:Jay L. Devore
Publisher:Cengage Learning
Statistics for The Behavioral Sciences (MindTap C...
Statistics
ISBN:9781305504912
Author:Frederick J Gravetter, Larry B. Wallnau
Publisher:Cengage Learning
Elementary Statistics: Picturing the World (7th E...
Statistics
ISBN:9780134683416
Author:Ron Larson, Betsy Farber
Publisher:PEARSON
The Basic Practice of Statistics
Statistics
ISBN:9781319042578
Author:David S. Moore, William I. Notz, Michael A. Fligner
Publisher:W. H. Freeman
Introduction to the Practice of Statistics
Statistics
ISBN:9781319013387
Author:David S. Moore, George P. McCabe, Bruce A. Craig
Publisher:W. H. Freeman