
MATLAB: An Introduction with Applications
6th Edition
ISBN: 9781119256830
Author: Amos Gilat
Publisher: John Wiley & Sons Inc
expand_more
expand_more
format_list_bulleted
Related questions
Question
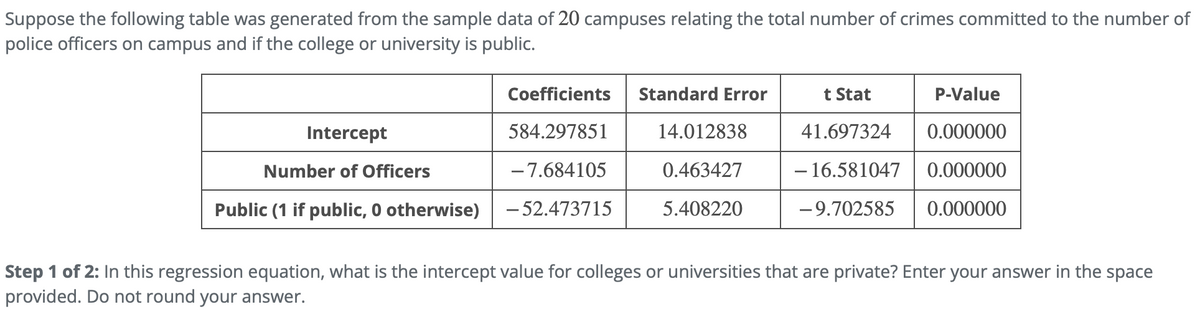

Transcribed Image Text:Suppose the following table was generated from the sample data of 20 campuses relating the total number of crimes committed to the number of
police officers on campus and if the college or university is public.
Coefficients
Standard Error
t Stat
P-Value
Intercept
584.297851
14.012838
41.697324
0.000000
Number of Officers
-7.684105
0.463427
- 16.581047
0.000000
Public (1 if public, O otherwise)
- 52.473715
5.408220
-9.702585
0.000000
Step 1 of 2: In this regression equation, what is the intercept value for colleges or universities that are private? Enter your answer in the space
provided. Do not round your answer.

Transcribed Image Text:Suppose the following table was generated from the sample data of 20 campuses relating the total number of crimes committed to the number of
police officers on campus and if the college or university is public.
Coefficients
Standard Error
t Stat
P-Value
Intercept
584.297851
14.012838
41.697324
0.000000
Number of Officers
-7.684105
0.463427
- 16.581047
0.000000
Public (1 if public, O otherwise) - 52.473715
5.408220
-9.702585
0.000000
Step 2 of 2: In this regression equation, what is the intercept value for colleges or universities that are public? Enter your answer in the space
provided. Do not round your answer.
Expert Solution
This question has been solved!
Explore an expertly crafted, step-by-step solution for a thorough understanding of key concepts.

This is a popular solution

Trending nowThis is a popular solution!

Step by stepSolved in 2 steps

Knowledge Booster

Similar questions
- The researcher took a random sample of 50 residents and found that the mean height of men is 175cm. Suppose that the team is made aware of the fact that the distribution of heights is distributed normally. 1, The sample median is an unbiased estimate of the mean height of men. Is the following statement about the estimator true? 2, Determine whether or not the median or mean is an efficient estimator of the population median.arrow_forwardSuppose the scores of students on an exam are Normally distributed with a mean of 522 and a standard deviation of 83. Then approximately 99.7% of the exam scores lie between the numbers such that the mean is halfway between these two integers. and ☐arrow_forwardA survey of 9 adults employed full-time was taken. Here are their reported numbers of hours worked per week: 46, 43, 41, 50, 41, 42, 49, 47, 38 Send data to calculator Send data to Excel |(a) What is the median of this data set? If your answer is not an integer, round your answer to one decimal place. (b) What is the mean of this data set? If your answer is not an n integer, round your answer to one decimal place. zero modes (c) How many modes does the data set have, and what are their values? Indicate the number of modes by clicking in the appropriate circle, and then indicate the value(s) of the mode(s), if applicable. one mode: O two modes: andn ?arrow_forward
- In a large city, researchers selected a random sample of 120 individuals who have multiple televisions in their house connected to a streaming device. Each individual was asked how many hours of streaming content they watch in a typical week. The sample had a mean of 12.5 hours. For which of the following populations is 12.5 hours a reasonable estimate of the mean hours of weekly streaming content watched? (A) All individuals who regularly watch streaming content (B) All individuals from this city who regularly watch streaming content (C) All individuals from this city with multiple streaming devices in their house (D) All individuals from this city with multiple streaming devices in their house who regularly watch streaming content (E) All 120 individuals in this city with multiple streaming devices in their home who regularly watch streaming contentarrow_forwardSuppose 140 geology students measure the mass of an ore sample. Due to human error and limitations in the reliability of the balance, not all the readings are equal. The results are found to closely approximate a normal curve, with mean 85 g and standard deviation 2 g. Use the symmetry of the normal curve and the empirical rule as needed to estimate the number of students reporting readings between 81 g and 89 g. The number of students reporting readings between 81 g and 89 g is (Round to the nearest whole number as needed.)arrow_forwardThe mean age of all 663 used cars for sale in a newspaper one Saturday last month was 7.5 years, with a standard deviation of7.1 years. The distribution ads, a reporter randomly selects 50 of these used cars and plans to visit each owner to inspect the cars. He finds that the mean age of the 50 cars he sam Complete parts a through c. a From the problem statement, which of the values 75,7.1, 7.9, and 5.6 are parameters and which are statistics? The value 7.5 is a The value 7.1 is a The value 7.9 is a The value 5.6 is aarrow_forward
- Monthly salary computations from two different companies yielded the following data: n1 = 7, x1=9,120$, s1=384$; n2 = 7, x2=8,820$, s2=214$. At the level of significance 0.05, can we conclude that the mean monthly salary from the two ompanies is not the same?arrow_forwardCalculate the 5 number summary and the interquartile range of the following data: 20, 36, 78, 18, 37, −33, 32, 44, 54, 28, 74, 12, 61, 47, 40, 4820, 36, 78, 18, 37, −33, 32, 44, 54, 28, 74, 12, 61, 47, 40, 48 Q1 = Q2 = Q3 = Min = Max = IQR =arrow_forwardSuppose a data set has size 10. Indicate which of the following would change if the maximum of the data set was replaced with a larger value. (a)First quartile (b)Median (c)Range (d)Meanarrow_forward
arrow_back_ios
arrow_forward_ios
Recommended textbooks for you
- MATLAB: An Introduction with ApplicationsStatisticsISBN:9781119256830Author:Amos GilatPublisher:John Wiley & Sons Inc
 Probability and Statistics for Engineering and th...StatisticsISBN:9781305251809Author:Jay L. DevorePublisher:Cengage Learning
 Statistics for The Behavioral Sciences (MindTap C...StatisticsISBN:9781305504912Author:Frederick J Gravetter, Larry B. WallnauPublisher:Cengage Learning
  Elementary Statistics: Picturing the World (7th E...StatisticsISBN:9780134683416Author:Ron Larson, Betsy FarberPublisher:PEARSON
 The Basic Practice of StatisticsStatisticsISBN:9781319042578Author:David S. Moore, William I. Notz, Michael A. FlignerPublisher:W. H. Freeman
 Introduction to the Practice of StatisticsStatisticsISBN:9781319013387Author:David S. Moore, George P. McCabe, Bruce A. CraigPublisher:W. H. Freeman
MATLAB: An Introduction with Applications
Statistics
ISBN:9781119256830
Author:Amos Gilat
Publisher:John Wiley & Sons Inc
Probability and Statistics for Engineering and th...
Statistics
ISBN:9781305251809
Author:Jay L. Devore
Publisher:Cengage Learning
Statistics for The Behavioral Sciences (MindTap C...
Statistics
ISBN:9781305504912
Author:Frederick J Gravetter, Larry B. Wallnau
Publisher:Cengage Learning
Elementary Statistics: Picturing the World (7th E...
Statistics
ISBN:9780134683416
Author:Ron Larson, Betsy Farber
Publisher:PEARSON
The Basic Practice of Statistics
Statistics
ISBN:9781319042578
Author:David S. Moore, William I. Notz, Michael A. Fligner
Publisher:W. H. Freeman
Introduction to the Practice of Statistics
Statistics
ISBN:9781319013387
Author:David S. Moore, George P. McCabe, Bruce A. Craig
Publisher:W. H. Freeman