MATLAB: An Introduction with Applications
6th Edition
ISBN: 9781119256830
Author: Amos Gilat
Publisher: John Wiley & Sons Inc
expand_more
expand_more
format_list_bulleted
Question

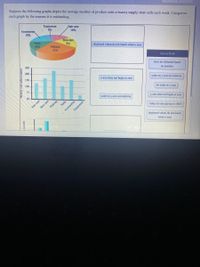
Transcribed Image Text:Suppose the following graphs depict the average number of product units a beauty supply store sells each week. Categorize
cach graph by the reasons it is misleading.
Equipment
8%
Accessories
Hair care
18%
16%
Skin care
9%
Nails
44%
Makeup
25%
displayed values do not match relative area
300
Answer Bank
200
sizes are distorted based
150
on position
100
v-axis does not begin at zero
scale on y-axis not uniform
75
50
no scale on y-axis
Skin care
Makeup
scale on y-axis not uniform
Hair care
y-axis does not begin at zero
Nails
Accessories
Equipment
values do not add up to 100%
displayed values do not match
relative area
Weekly unit sales (count)

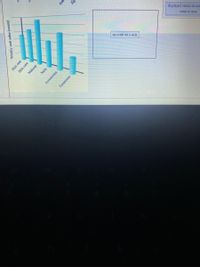
Transcribed Image Text:Acc
Eq
displayed values do not
no scale on y-axis
relative area
Accessories
Equipment
Weekly unit sales (count)
Hair care
Skin care
Makeup
Nails
Expert Solution
This question has been solved!
Explore an expertly crafted, step-by-step solution for a thorough understanding of key concepts.
This is a popular solution
Trending nowThis is a popular solution!
Step by stepSolved in 3 steps with 3 images

Knowledge Booster
Similar questions
- the question with all details is in image down below? please do not reject the question?arrow_forwardPlease indicate which plot best summarizes the characeristic the characteristic (the name of the plot, not the function)i. Which plot best allows one to identify points that are outliers (i.e. far from the central location the data):A: Boxplot B: Histogramii. Which plot best allows one to assess the skew of the data: A: Boxplot B: Histogramarrow_forwardAn economist want to determine the relation between one’s FICO score, x, and the interest rate of a 36-month auto loan, y. The given data represent the interest rate (in percent) a bank would offer on a 36-month auto load for various FICO scores. Credit Score;x Interest Rate (percent);y 545 18.982 595 17.967 640 12.218 675 8.612 705 6.68 750 5.15 Find the least-squares regression line treating the FICO score as the explanatory variable and the interest rate as the response variable. Predict the interest rate a person would pay if their FICO score were the median score of 723.arrow_forward
- The bar chart below shows the speed (in gigaflops using a test package) of several processors. It is intended to be used to compare the overall speeds of the processors for consumers. Identify any misrepresentation issues in the graph.arrow_forwardThe data listed below represents the number of customers entering a food store by the number of hours the store was opened on a particular day. Hours Opened Customers 0 0 2 1 4 3 6 5 8 2 10 11 12 15 Create the corresponding line graph to represent this data below.arrow_forwardWhich graphic representation are appropriate when we wish to illustrate complex relationships among variables that cannot be shown with tables or text, or to show trends or geographic variations?arrow_forward
- In a certain country, total alcoholic beverage sales are reported throughout the year. Sales were reported as $118.5 billion at the beginning of 2004 and $136.2 billion at the beginning of 2006. (a) Let the x-axis denote time and the y-axis denote the amount of alcohol sales (in billions), Let x = 0 correspond to 2004. Fill in the blanks: The given data is represented by the points ( 118.5) and (2, ). (b) Find the linear equation determined by the two points in part (a). (c) Use the equation in part (b) to estimate the alcohol sales produced in 2005. (d) If the model remains accurate, in what year will reported alcohol sales reach $150 billion? (a) The given data is represented by the points (,118.5) and (2,). (Type integers decimals rounded to one decimal place.) (b) The linear equation determined by the two points in part (a) is y =x+. (Type integers or decimals rounded to one decimal place.) (c) The alcohol sales produced in 2005 are approximately $ billion. (Type an integer or…arrow_forwardHelloarrow_forwardWhat type of graph is this, and is it displaying Ordinal, Interval, Nominal, or Ratio Data?arrow_forward
- A company has the following monthly sales for the past year. Plot the data points on a line graph and describe the results. Month Sales 1 145 2 146 3 145 4 150 5 148 6 150 7 156 8 160 9 158 10 153 11 152 12 154arrow_forwardWhich graphs are used for quantitative data? Group of answer choices Boxplot Pictogram Histogram Line Graph Bar Graph Pie Chart Stem & Leaf Plot Dot Plotarrow_forwardA car dealership is analyzing the changes in its monthly sales. They sold 40 cars in March, 55 in April, 61 in May, 29 in June, 63 in July, and 40 in August. Create line graph that represents this data. 3.arrow_forward
arrow_back_ios
SEE MORE QUESTIONS
arrow_forward_ios
Recommended textbooks for you
 MATLAB: An Introduction with ApplicationsStatisticsISBN:9781119256830Author:Amos GilatPublisher:John Wiley & Sons Inc
 Probability and Statistics for Engineering and th...StatisticsISBN:9781305251809Author:Jay L. DevorePublisher:Cengage Learning
 Statistics for The Behavioral Sciences (MindTap C...StatisticsISBN:9781305504912Author:Frederick J Gravetter, Larry B. WallnauPublisher:Cengage Learning
 Elementary Statistics: Picturing the World (7th E...StatisticsISBN:9780134683416Author:Ron Larson, Betsy FarberPublisher:PEARSON
 The Basic Practice of StatisticsStatisticsISBN:9781319042578Author:David S. Moore, William I. Notz, Michael A. FlignerPublisher:W. H. Freeman
 Introduction to the Practice of StatisticsStatisticsISBN:9781319013387Author:David S. Moore, George P. McCabe, Bruce A. CraigPublisher:W. H. Freeman

MATLAB: An Introduction with Applications
Statistics
ISBN:9781119256830
Author:Amos Gilat
Publisher:John Wiley & Sons Inc

Probability and Statistics for Engineering and th...
Statistics
ISBN:9781305251809
Author:Jay L. Devore
Publisher:Cengage Learning

Statistics for The Behavioral Sciences (MindTap C...
Statistics
ISBN:9781305504912
Author:Frederick J Gravetter, Larry B. Wallnau
Publisher:Cengage Learning

Elementary Statistics: Picturing the World (7th E...
Statistics
ISBN:9780134683416
Author:Ron Larson, Betsy Farber
Publisher:PEARSON

The Basic Practice of Statistics
Statistics
ISBN:9781319042578
Author:David S. Moore, William I. Notz, Michael A. Fligner
Publisher:W. H. Freeman

Introduction to the Practice of Statistics
Statistics
ISBN:9781319013387
Author:David S. Moore, George P. McCabe, Bruce A. Craig
Publisher:W. H. Freeman