Related questions
Question
3 answers

Transcribed Image Text:**Understanding Sound Wave Data: An Educational Exercise**
**Problem Statement:**
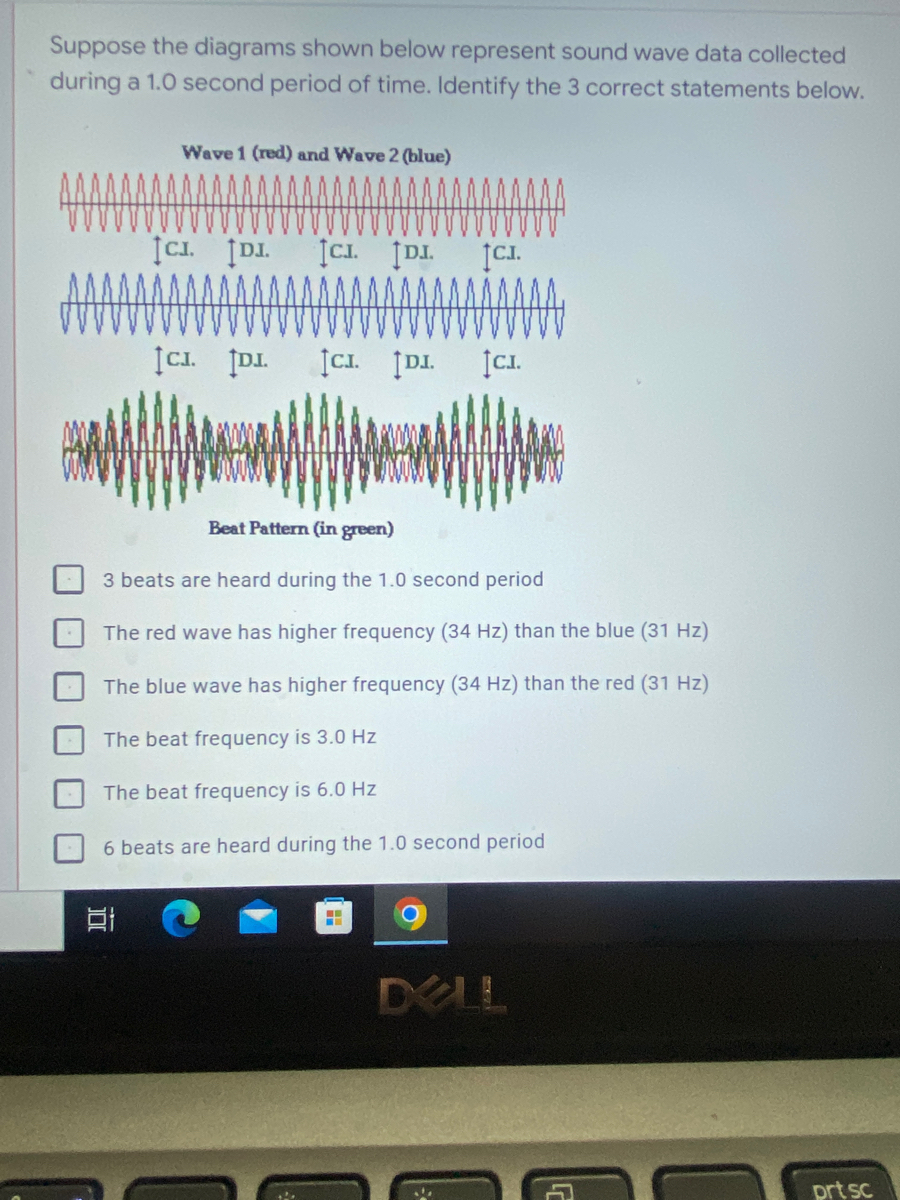
Suppose the diagrams shown below represent sound wave data collected during a 1.0 second period of time. Identify the 3 correct statements below.
**Wave Representation:**
- **Wave 1 (red) and Wave 2 (blue)**
- These two diagrams show two sound waves, one in red and one in blue.
- The waves exhibit periodic waveforms, and both contain notable crests (labelled as "C.I.") and depressions (labelled as "D.I.").
- **Beat Pattern (in green)**
- This diagram combines the red and blue waveforms to show the resultant beat pattern in green.
- The beat pattern displays a series of amplitude oscillations as a result of the interference between the two waves.
**Wave Analysis:**
**Given Options:**
1. 3 beats are heard during the 1.0 second period
2. The red wave has higher frequency (34 Hz) than the blue (31 Hz)
3. The blue wave has higher frequency (34 Hz) than the red (31 Hz)
4. The beat frequency is 3.0 Hz
5. The beat frequency is 6.0 Hz
6. 6 beats are heard during the 1.0 second period
**Graph and Diagram Explanation:**
**Wave 1 (red) and Wave 2 (blue):**
- The red wave appears above the blue wave. There are periodic intervals labelled C.I. (Crest Interval) and D.I. (Depression Interval) highlighting the peaks and troughs.
- Both waveforms display a certain number of cycles within the 1.0-second frame. The number of cycles in each wave can help determine their respective frequencies.
**Beat Pattern (in green):**
- Represented below the individual waveforms, the beat pattern combines both waves to show alternating constructive and destructive interference.
- This results in areas of higher (constructive interference) and lower amplitude (destructive interference), creating a visual pattern of larger and smaller wave packets.
**Instructions:**
Review the wave diagrams and beat pattern to select the accurate choices about frequencies and beat patterns from the six given options.
This exercise is aimed at understanding wave interference, frequency determination, and the concept of beats in wave mechanics.
Expert Solution
This question has been solved!
Explore an expertly crafted, step-by-step solution for a thorough understanding of key concepts.

This is a popular solution

Trending nowThis is a popular solution!

Step by stepSolved in 2 steps

Knowledge Booster

Similar questions
arrow_back_ios
SEE MORE QUESTIONS
arrow_forward_ios