ENGR.ECONOMIC ANALYSIS
14th Edition
ISBN: 9780190931919
Author: NEWNAN
Publisher: Oxford University Press
expand_more
expand_more
format_list_bulleted
Question
Topic: Geometric Gradient Series

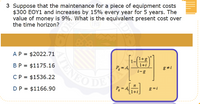
Transcribed Image Text:3 Suppose that the maintenance for a piece of equipment costs
$300 EOY1 and increases by 15% every year for 5 years. The
value of money is 9%. What is the equivalent present cost over
the time horizon?
AP = $2022.71
(1+g
1+i
ENEODE
В Р
BP = $1175.16
P, = A
g#i
%3D
i-g
CP = $1536.22
n
P = A
g = i
DP = $1166.90
Expert Solution
This question has been solved!
Explore an expertly crafted, step-by-step solution for a thorough understanding of key concepts.
This is a popular solution
Trending nowThis is a popular solution!
Step by stepSolved in 2 steps

Knowledge Booster
Learn more about
Need a deep-dive on the concept behind this application? Look no further. Learn more about this topic, economics and related others by exploring similar questions and additional content below.Similar questions
- Give an analysis of Elephant Chart by Branko Milanovic.arrow_forwardThe table lists weights (pounds) and highway mileage amounts (mpg) for seven automobiles. Use the sample data to construct a scatterplot. Use the first variable for the x-axis. Based on the scatterplot, what do you conclude about a linear correlation? Weight (lb) Highway (mpg) Which scatterplot below shows the data? O A. 40- 20+ 2000 5000 2855 3050 3810 3985 4250 2275 3525 33 32 27 24 22 39 28 Weight (lb) Q Q O B. 40 20+ 2000 AHH 5000 Weight (lb) Q Q Is there a linear relationship between weight and highway mileage? O A. No, there appears to be a relationship, but it is not linear. O B. Yes, as the weight increases the highway mileage decreases. O C. Yes, as the weight increases the highway mileage increases. OD. No there appears to be no relationshin C O C. Q 40- M Q 20++ 2000 5000 Weight (lb) Highway ( O D. Highway (mpg) 40- 20+ 2000 5000 Weight (lb) Qarrow_forwardQuestion 2 For each of the following variables, indicate whether the data are time series or cross-sectional. v Spending on household goods recorded monthly. A. time series v The annual percentage change in the population of Houston recorded over the last 10 B. cross-sectional years. v The percentage of adults 25-40 who report using online bil payment methods. v The number of students at a university who use the on-campus health and recreation center each day, recorded over a semester. Revenue for the month of August in 2016 for all Starbucks locations in the Houston area. v A data set created today by a credit card bank showing the total spending of each of its customers for the last three months.arrow_forward
arrow_back_ios
arrow_forward_ios
Recommended textbooks for you

 Principles of Economics (12th Edition)EconomicsISBN:9780134078779Author:Karl E. Case, Ray C. Fair, Sharon E. OsterPublisher:PEARSON
 Engineering Economy (17th Edition)EconomicsISBN:9780134870069Author:William G. Sullivan, Elin M. Wicks, C. Patrick KoellingPublisher:PEARSON
 Principles of Economics (MindTap Course List)EconomicsISBN:9781305585126Author:N. Gregory MankiwPublisher:Cengage Learning
 Managerial Economics: A Problem Solving ApproachEconomicsISBN:9781337106665Author:Luke M. Froeb, Brian T. McCann, Michael R. Ward, Mike ShorPublisher:Cengage Learning
 Managerial Economics & Business Strategy (Mcgraw-...EconomicsISBN:9781259290619Author:Michael Baye, Jeff PrincePublisher:McGraw-Hill Education


Principles of Economics (12th Edition)
Economics
ISBN:9780134078779
Author:Karl E. Case, Ray C. Fair, Sharon E. Oster
Publisher:PEARSON

Engineering Economy (17th Edition)
Economics
ISBN:9780134870069
Author:William G. Sullivan, Elin M. Wicks, C. Patrick Koelling
Publisher:PEARSON

Principles of Economics (MindTap Course List)
Economics
ISBN:9781305585126
Author:N. Gregory Mankiw
Publisher:Cengage Learning

Managerial Economics: A Problem Solving Approach
Economics
ISBN:9781337106665
Author:Luke M. Froeb, Brian T. McCann, Michael R. Ward, Mike Shor
Publisher:Cengage Learning

Managerial Economics & Business Strategy (Mcgraw-...
Economics
ISBN:9781259290619
Author:Michael Baye, Jeff Prince
Publisher:McGraw-Hill Education