
MATLAB: An Introduction with Applications
6th Edition
ISBN: 9781119256830
Author: Amos Gilat
Publisher: John Wiley & Sons Inc
expand_more
expand_more
format_list_bulleted
Related questions
Question
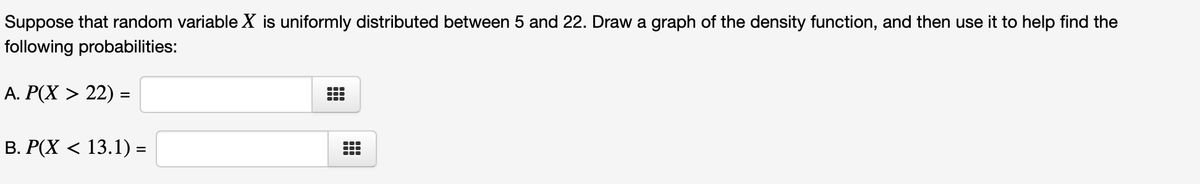

Transcribed Image Text:Suppose that random variable X is uniformly distributed between 5 and 22. Draw a graph of the density function, and then use it to help find the
following probabilities:
A. P(X > 22) =
B. P(X < 13.1) =
Expert Solution
This question has been solved!
Explore an expertly crafted, step-by-step solution for a thorough understanding of key concepts.

This is a popular solution

Trending nowThis is a popular solution!

Step by stepSolved in 4 steps with 2 images

Knowledge Booster

Similar questions
- Suppose that random variable X is uniformly distributed between 5 and 22. Draw a graph of the density function, and then use it to help find the following probabilities:arrow_forwardA random variable X has density 3x2 for 0 < x < 1. Find its variance.(use a decimal number, rounded to the nearest 1,000th. For example, 0.123)arrow_forwardSuppose X is a random variable defined as final cost of project estimated cost of project which has a PDF as follows: [0 xa a. Determine the value of a. b. What is the probability that the final cost of a project will exceed its estimated cost by 25%? c. Determine the mean value and standard deviation of X.arrow_forward
- For the given probability density function, over the given interval, find the mean, the variance, and the standard deviation. 36) f(x)== // [12, 20] 36) B) μ = 16; o² = 5.33; o = 2.31 A) μ = 15.5; o2=5.20; o = 2.28 C) μ = 15; o2 = 5.34; o = 2.31 D) μ= 1.6; o2 = 5.24; o=2.29arrow_forward2. Consider a gas station's daily sales. Let Y be the volume of gas sold per day in 1000s of gallons. Assume the distribution of Y follows this pdf: 1sxs 2 S (v) . else What value of k is required for the above function to be a valid pdf? b. Verify that the function given is a valid probability density а. function c. Determine the cumulative distribution function (cdf) of the random variable d. Compute the probability that there is exactly 1500 gallons of sales on a given day (Hint: Find?(r - 1.5)) = 1 CO0arrow_forwardConsider hourly wages, letting x be an individual's wage and assuming that wages in the population follow a continuous uniform distribution, ranging from the lowest value of $11 to the highest value of $36. Please answer each of the following: Write down the probability density function, f(x) for the random variable x . Compute P(x<14) Compute P(20<x<30) Compute P(x>34)arrow_forward
arrow_back_ios
arrow_forward_ios
Recommended textbooks for you
- MATLAB: An Introduction with ApplicationsStatisticsISBN:9781119256830Author:Amos GilatPublisher:John Wiley & Sons Inc
 Probability and Statistics for Engineering and th...StatisticsISBN:9781305251809Author:Jay L. DevorePublisher:Cengage Learning
 Statistics for The Behavioral Sciences (MindTap C...StatisticsISBN:9781305504912Author:Frederick J Gravetter, Larry B. WallnauPublisher:Cengage Learning
  Elementary Statistics: Picturing the World (7th E...StatisticsISBN:9780134683416Author:Ron Larson, Betsy FarberPublisher:PEARSON
 The Basic Practice of StatisticsStatisticsISBN:9781319042578Author:David S. Moore, William I. Notz, Michael A. FlignerPublisher:W. H. Freeman
 Introduction to the Practice of StatisticsStatisticsISBN:9781319013387Author:David S. Moore, George P. McCabe, Bruce A. CraigPublisher:W. H. Freeman
MATLAB: An Introduction with Applications
Statistics
ISBN:9781119256830
Author:Amos Gilat
Publisher:John Wiley & Sons Inc
Probability and Statistics for Engineering and th...
Statistics
ISBN:9781305251809
Author:Jay L. Devore
Publisher:Cengage Learning
Statistics for The Behavioral Sciences (MindTap C...
Statistics
ISBN:9781305504912
Author:Frederick J Gravetter, Larry B. Wallnau
Publisher:Cengage Learning
Elementary Statistics: Picturing the World (7th E...
Statistics
ISBN:9780134683416
Author:Ron Larson, Betsy Farber
Publisher:PEARSON
The Basic Practice of Statistics
Statistics
ISBN:9781319042578
Author:David S. Moore, William I. Notz, Michael A. Fligner
Publisher:W. H. Freeman
Introduction to the Practice of Statistics
Statistics
ISBN:9781319013387
Author:David S. Moore, George P. McCabe, Bruce A. Craig
Publisher:W. H. Freeman