
MATLAB: An Introduction with Applications
6th Edition
ISBN: 9781119256830
Author: Amos Gilat
Publisher: John Wiley & Sons Inc
expand_more
expand_more
format_list_bulleted
Related questions
Question

Transcribed Image Text:Obstetrics
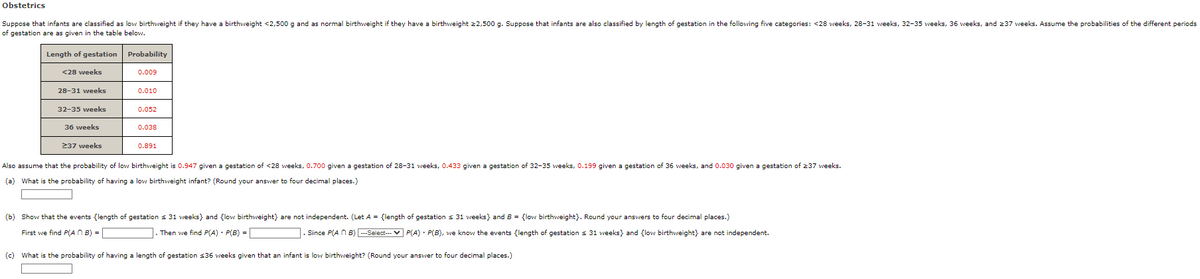
Suppose that infants are classified as low birthweight if they have a birthweight <2,500 g and as normal birthweight if they have a birthweight 22,500 g. Suppose that infants are also classified by length of gestation in the following five categories: <28 weeks, 28-31 weeks, 32-35 weeks, 36 weeks, and 237 weeks. Assume the probabilities of the different periods
of gestation are as given in the table below.
Length of gestation Probability
<28 weeks
28-31 weeks
32-35 weeks
36 weeks
237 weeks
0.009
0.010
0.052
0.038
0.891
Also assume that the probability of low birthweight is 0.947 given a gestation of <28 weeks, 0.700 given a gestation of 28-31 weeks, 0.433 given a gestation of 32-35 weeks, 0.199 given a gestation of 36 weeks, and 0.030 given a gestation of 237 weeks.
(a) What is the probability of having a low birthweight infant? (Round your answer to four decimal places.)
(b) Show that the events (length of gestation ≤ 31 weeks) and (low birthweight} are not independent. (Let A = {length of gestations 31 weeks) and B = {(low birthweight}. Round your answers to four decimal places.)
First we find P(An B) =
Then we find P(A) P(B) =
Since P(AB) ---Select--- P(A) · P(B), we know the events (length of gestations 31 weeks) and (low birthweight} are not independent.
.
(c) What is the probability of having a length of gestation $36 weeks given that an infant is low birthweight? (Round your answer to four decimal places.)
Expert Solution
This question has been solved!
Explore an expertly crafted, step-by-step solution for a thorough understanding of key concepts.

This is a popular solution

Trending nowThis is a popular solution!

Step by stepSolved in 3 steps

Knowledge Booster

Similar questions
- Differentiate between mutually exclusive and collectively exhaustive events.arrow_forwardAn electronic component is known to have a useful life which follows a probability distribution with failure rate of 10−5 failures per hour. What is the probability that the component would fail before the mean life of expected life?arrow_forwardAssume the below life table was constructed from following individuals who were diagnosed with a slow-progressing form of prostate cancer and decided not to receive treatment of any form. Calculate the survival probability at year 1 using the Kaplan-Meir approach and interpret the results. Time in Years Number at Risk, Nt Number of Deaths, Dt Number Censored, Ct Survival Probability 0 20 1 1 20 3 2 17 1 3 16 2 1 A) The probability of surviving 1 year after being diagnosed with a slow-progressing form of prostate cancer is .85. B) The probability of surviving 1 year after being diagnosed with a slow-progressing form of prostate cancer is .85 for the individuals being followed in this study. C) The probability of surviving 1 year after being diagnosed with a slow-progressing form of prostate cancer is .85 for individuals who decided against all forms of treatment. D) The probability of surviving 1 year…arrow_forward
- If the mean time is between unscheduled maintained of lcd displays in a hospital scan facility is 4,000 operating hours, what is the probability of unscheduled maintenance in the next 5,000 hourdarrow_forwardWhen can we say that populations are normally distributed?arrow_forwardSuppose that in a large population of women (aged 20 to 29-years-old) that the mean serum cholesterol level is 183 mg/dl and the standard deviation is 37. Find the probability that a sample of size 60 from this population will yield a mean cholesterol level. Less than 175arrow_forward
- Suppose the number of births at a local hospital follows a Poisson distribution with a mean of 6 births per week. What is the probability there will be at least 2 births next week?arrow_forward5. what is an A probability function using two coefficients, a and b, whose sum equals 1 and whose products predict the probability of events ?arrow_forwardThe weights of coconuts from a plantation have mean 3 and standard deviation 1 (pounds). Fifty coconuts are selected randomly. Find the probability the same fifty coconuts together weigh more than 165 pounds.arrow_forward
- Assume the below life table was constructed from following individuals who were diagnosed with a slow-progressing form of prostate cancer and decided not to receive treatment of any form. Calculate the survival probability at year 1 using the Kaplan-Meir approach and interpret the results. Time in Years Number at Risk, Nt Number of Deaths, Dt Number Censored, Ct Survival Probability 0 20 1 1 20 3 2 17 1 3 16 2 1 A) The probability of surviving 1 year after being diagnosed with a slow-progressing form of prostate cancer is .85. B) The probability of surviving 1 year after being diagnosed with a slow-progressing form of prostate cancer is .85 for the individuals being followed in this study. C) The probability of surviving 1 year after being diagnosed with a slow-progressing form of prostate cancer is .85 for individuals who decided against all forms of treatment. D) The probability of surviving 1 year…arrow_forwardAssume the below life table was constructed from following individuals who were diagnosed with a slow-progressing form of prostate cancer and decided not to receive treatment of any form. Calculate the survival probability at year 2 using the Kaplan-Meir approach and interpret the results. Time in Years Number at Risk, Nt Number of Deaths, Dt Number Censored, Ct Survival Probability 0 20 1 1 20 3 2 17 1 3 16 2 1 A) The probability of surviving 2 years after being diagnosed with a slow-progressing form of prostate cancer is .85. B) The probability of surviving 2 years after being diagnosed with a slow-progressing form of prostate cancer is .85 for the individuals being followed in this study. C) The probability of surviving 2 years after being diagnosed with a slow-progressing form of prostate cancer is .85 for individuals who decided against all forms of treatment. D) The probability of surviving 2 years…arrow_forwardAssume the below life table was constructed from following individuals who were diagnosed with a slow-progressing form of prostate cancer and decided not to receive treatment of any form. Calculate the survival probability at year 2 using the Kaplan-Meir approach and interpret the results. Time in Years Number at Risk, Nt Number of Deaths, Dt Number Censored, Ct Survival Probability 0 20 1 1 20 3 2 17 1 3 16 2 1 A) The probability of surviving 2 years after being diagnosed with a slow-progressing form of prostate cancer is .85. B) The probability of surviving 2 years after being diagnosed with a slow-progressing form of prostate cancer is .85 for the individuals being followed in this study. C) The probability of surviving 2 years after being diagnosed with a slow-progressing form of prostate cancer is .85 for individuals who decided against all forms of treatment. D) The probability of surviving 2 years…arrow_forward
arrow_back_ios
SEE MORE QUESTIONS
arrow_forward_ios
Recommended textbooks for you
- MATLAB: An Introduction with ApplicationsStatisticsISBN:9781119256830Author:Amos GilatPublisher:John Wiley & Sons Inc
 Probability and Statistics for Engineering and th...StatisticsISBN:9781305251809Author:Jay L. DevorePublisher:Cengage Learning
 Statistics for The Behavioral Sciences (MindTap C...StatisticsISBN:9781305504912Author:Frederick J Gravetter, Larry B. WallnauPublisher:Cengage Learning
  Elementary Statistics: Picturing the World (7th E...StatisticsISBN:9780134683416Author:Ron Larson, Betsy FarberPublisher:PEARSON
 The Basic Practice of StatisticsStatisticsISBN:9781319042578Author:David S. Moore, William I. Notz, Michael A. FlignerPublisher:W. H. Freeman
 Introduction to the Practice of StatisticsStatisticsISBN:9781319013387Author:David S. Moore, George P. McCabe, Bruce A. CraigPublisher:W. H. Freeman
MATLAB: An Introduction with Applications
Statistics
ISBN:9781119256830
Author:Amos Gilat
Publisher:John Wiley & Sons Inc
Probability and Statistics for Engineering and th...
Statistics
ISBN:9781305251809
Author:Jay L. Devore
Publisher:Cengage Learning
Statistics for The Behavioral Sciences (MindTap C...
Statistics
ISBN:9781305504912
Author:Frederick J Gravetter, Larry B. Wallnau
Publisher:Cengage Learning
Elementary Statistics: Picturing the World (7th E...
Statistics
ISBN:9780134683416
Author:Ron Larson, Betsy Farber
Publisher:PEARSON
The Basic Practice of Statistics
Statistics
ISBN:9781319042578
Author:David S. Moore, William I. Notz, Michael A. Fligner
Publisher:W. H. Freeman
Introduction to the Practice of Statistics
Statistics
ISBN:9781319013387
Author:David S. Moore, George P. McCabe, Bruce A. Craig
Publisher:W. H. Freeman