
MATLAB: An Introduction with Applications
6th Edition
ISBN: 9781119256830
Author: Amos Gilat
Publisher: John Wiley & Sons Inc
expand_more
expand_more
format_list_bulleted
Related questions
Question
Can you explain why the number of
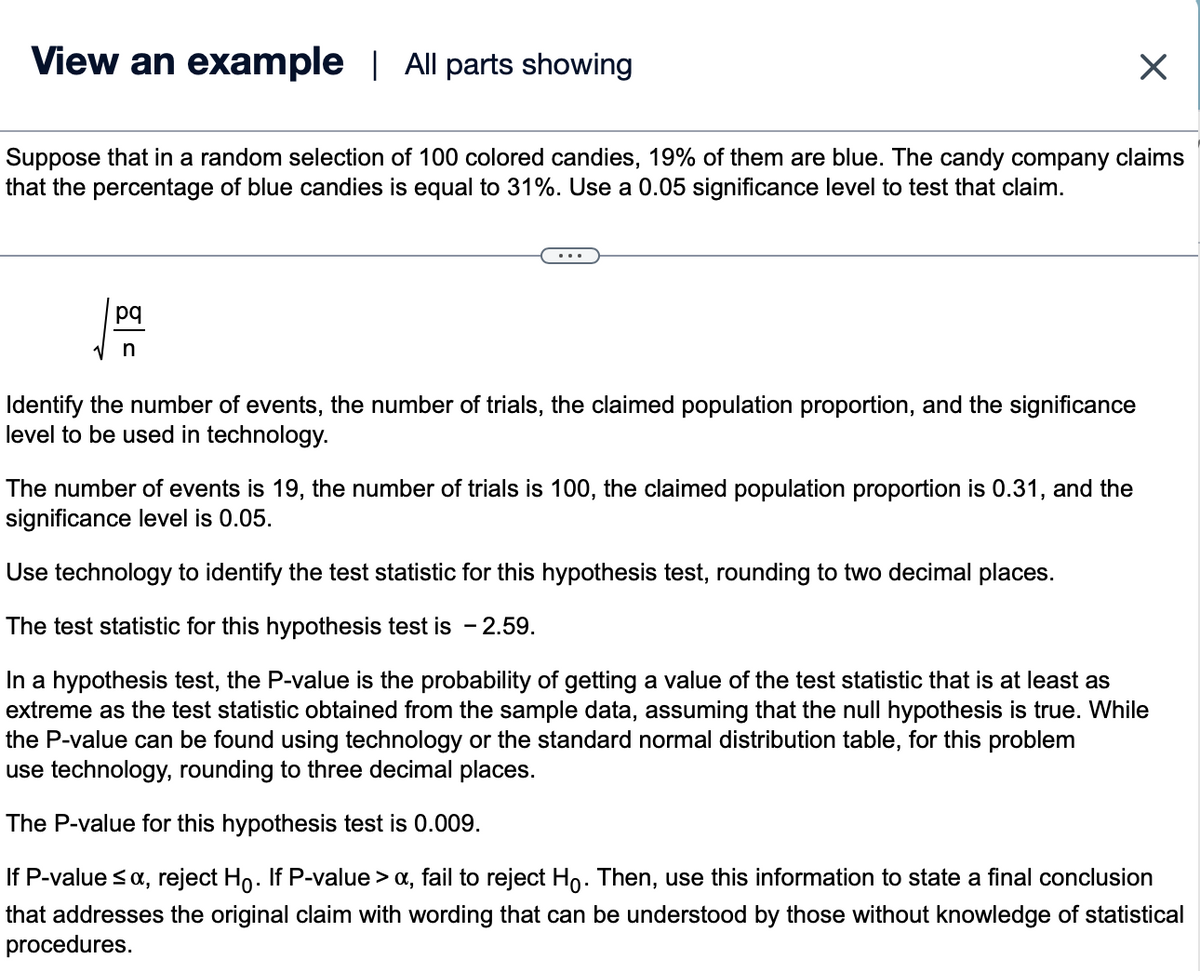

Transcribed Image Text:View an example | All parts showing
Suppose that in a random selection of 100 colored candies, 19% of them are blue. The candy company claims
that the percentage of blue candies is equal to 31%. Use a 0.05 significance level to test that claim.
pq
n
Identify the number of events, the number of trials, the claimed population proportion, and the significance
level to be used in technology.
The number of events is 19, the number of trials is 100, the claimed population proportion is 0.31, and the
significance level is 0.05.
X
Use technology to identify the test statistic for this hypothesis test, rounding to two decimal places.
The test statistic for this hypothesis test is - 2.59.
In a hypothesis test, the P-value is the probability of getting a value of the test statistic that is at least as
extreme as the test statistic obtained from the sample data, assuming that the null hypothesis is true. While
the P-value can be found using technology or the standard normal distribution table, for this problem
use technology, rounding to three decimal places.
The P-value for this hypothesis test is 0.009.
If P-value ≤ α, reject Ho. If P-value > a, fail to reject Hỏ. Then, use this information to state a final conclusion
that addresses the original claim with wording that can be understood by those without knowledge of statistical
procedures.
Expert Solution
This question has been solved!
Explore an expertly crafted, step-by-step solution for a thorough understanding of key concepts.

This is a popular solution

Trending nowThis is a popular solution!

Step by stepSolved in 5 steps with 9 images

Follow-up Questions
Read through expert solutions to related follow-up questions below.
Follow-up Question
You said the P-value is 0.995339, if that is the p-value, why arent we multiplying 0.995339 by 2 instead of 0.004661? Are you assuming that the p-value 0.995339 is for the left-tail and if so why?
Solution
by Bartleby Expert
Knowledge Booster

Similar questions
- When you are done, click here to see a summary of your score Question with last attempt is displayed for your review only In a certain school district, it was observed that 29% of the students in the element schools were classified as only children (no siblings). However, in the special program for talented and gifted children, 130 out of 373 students are only children. The school district administrators want to know if the proportion of only children in the special program Is significantly different from the proportion for the school district. Test at the a 0.05 level of significance. What is the hypothesized population proportion for this test? P=0.34 (Report answer as a decimal accurate to 2 decimal places. Do not report using the percent symbol.) Based on the statement of this problem, how many tails would this hypothesis test have? one-tailed test two-tailed test Choose the correct pair of hypotheses for this situation: (A) (C) Ho p 0.29 0.29 (В) Но:P 0.29 Ho: p 0.29 H: p 0.29 (D)…arrow_forwardPlease show work In a sample of 100 people, 57 completed only high school, 23 went on to complete only some college, 13 went on to complete a two-year or four-year college, and 7 went on to graduate school. What proportion of the sample does not have a two-year or four-year college degree? 0.07 0.13 0.80 0.87arrow_forwardtopic is Hypothesis test for proportions. I already answered most of the question. Please help me fill the rest. Thanksarrow_forward
- Wildlife biologist inspects 153 deer taken by hunters and find 32 of them carrying Lyme disease ticks. 1). If the scientist want to estimate the proportion of the deer that carry Lyme disease ticks within 2% with 90% confidence how many deer should they sample?arrow_forwardThe American Heart Association is about to conduct an anti-smoking campaign and wants to know the fraction of Americans over 38 who smoke. Step 1 of 2: Suppose a sample of 273 Americans over 38 is drawn. Of these people, 79 smoke. Using the data, estimate the proportion of Americans over 38 who smoke. Enter your answer as a fraction or a decimal number rounded to three decimal places. Step 2 of 2: Suppose a sample of 273 Americans over 38 is drawn. Of these people, 79 smoke. Using the data, construct the 85% confidence interval for the population proportion of Americans over 38 who smoke. Round your answers to three decimal places. Lower end point, upper end pointarrow_forwardBelow is a research question, please answer the following question. After it is solved, you can simply replace the highlighted sentences (the format you should follow, please follow the highlighted sentence format) with the correct answer.arrow_forward
- There are 9700 subject with 1940 showing improvement, what is the margin of error for a 99% intervalarrow_forwardYou want to test whether the true proportion teenagers who can swim is below 1/4. In a random sample of 70 teenagers, 40 can swim. what is the test statistic for the test?arrow_forwardYou are testing the claim that the proportion of men who own cats is smaller than the proportion of women who own cats.You sample 90 men, and 80% own cats.You sample 110 women, and 70% own cats. test statistic = [three decimal accuracy]arrow_forward
arrow_back_ios
arrow_forward_ios
Recommended textbooks for you
- MATLAB: An Introduction with ApplicationsStatisticsISBN:9781119256830Author:Amos GilatPublisher:John Wiley & Sons Inc
 Probability and Statistics for Engineering and th...StatisticsISBN:9781305251809Author:Jay L. DevorePublisher:Cengage Learning
 Statistics for The Behavioral Sciences (MindTap C...StatisticsISBN:9781305504912Author:Frederick J Gravetter, Larry B. WallnauPublisher:Cengage Learning
  Elementary Statistics: Picturing the World (7th E...StatisticsISBN:9780134683416Author:Ron Larson, Betsy FarberPublisher:PEARSON
 The Basic Practice of StatisticsStatisticsISBN:9781319042578Author:David S. Moore, William I. Notz, Michael A. FlignerPublisher:W. H. Freeman
 Introduction to the Practice of StatisticsStatisticsISBN:9781319013387Author:David S. Moore, George P. McCabe, Bruce A. CraigPublisher:W. H. Freeman
MATLAB: An Introduction with Applications
Statistics
ISBN:9781119256830
Author:Amos Gilat
Publisher:John Wiley & Sons Inc
Probability and Statistics for Engineering and th...
Statistics
ISBN:9781305251809
Author:Jay L. Devore
Publisher:Cengage Learning
Statistics for The Behavioral Sciences (MindTap C...
Statistics
ISBN:9781305504912
Author:Frederick J Gravetter, Larry B. Wallnau
Publisher:Cengage Learning
Elementary Statistics: Picturing the World (7th E...
Statistics
ISBN:9780134683416
Author:Ron Larson, Betsy Farber
Publisher:PEARSON
The Basic Practice of Statistics
Statistics
ISBN:9781319042578
Author:David S. Moore, William I. Notz, Michael A. Fligner
Publisher:W. H. Freeman
Introduction to the Practice of Statistics
Statistics
ISBN:9781319013387
Author:David S. Moore, George P. McCabe, Bruce A. Craig
Publisher:W. H. Freeman