
MATLAB: An Introduction with Applications
6th Edition
ISBN: 9781119256830
Author: Amos Gilat
Publisher: John Wiley & Sons Inc
expand_more
expand_more
format_list_bulleted
Related questions
Question
Suppose that a sample has been drawn from a normal population to conduct the hypothesis test
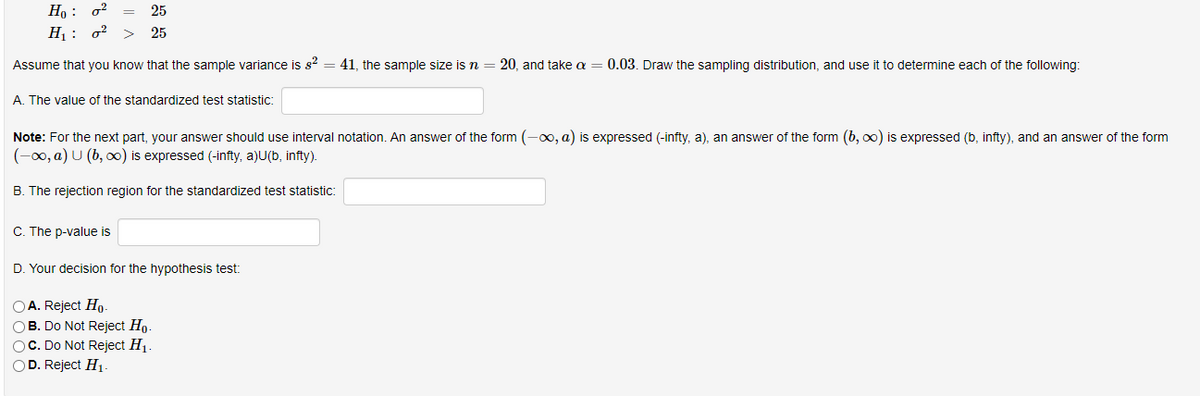

Transcribed Image Text:Но :
Hị : o?
25
25
Assume that you know that the sample variance is s? = 41, the sample size is n = 20, and take a = 0.03. Draw the sampling distribution, and use it to determine each of the following:
A. The value of the standardized test statistic:
Note: For the next part, your answer should use interval notation. An answer of the form (-0, a) is expressed (-infty, a), an answer of the form (b, o0) is expressed (b, infty), and an answer of the form
(-0, a) U (b, 0) is expressed (-infty, a)U(b, infty).
B. The rejection region for the standardized test statistic:
C. The p-value is
D. Your decision for the hypothesis test:
OA. Reject Ho-
OB. Do Not Reject Ho.
OC. Do Not Reject H1.
OD. Reject H1.
Expert Solution
This question has been solved!
Explore an expertly crafted, step-by-step solution for a thorough understanding of key concepts.

This is a popular solution

Trending nowThis is a popular solution!

Step by stepSolved in 4 steps

Knowledge Booster


Learn more about
Need a deep-dive on the concept behind this application? Look no further. Learn more about this topic, statistics and related others by exploring similar questions and additional content below.Similar questions
- Write out the null and alternative hypotheses (making sure that your notation is understandable) and the distribution of the test statistic (but not the test statistic itself) used to address these questions.arrow_forwardFind the p-value for a right-tailed hypothesis test with a test statistic of z=-2.78arrow_forwardWhat does the null hypothesis assume for two independent sample t test?arrow_forward
- Suppose a hypothesis test was performed with a level of significance of 0.05. Then if the null hypothesis is actually true, then there is a 5% chance that the researcher will end up rejecting the null hypothesis in error. True Falsearrow_forwardWhat is the critical value for an upper‐tailed hypothesis test of the population mean when the population variance is unknown in which a null hypothesis is tested at the 0.10 level of significance based on a sample size of 19? 1.645 1.328 1.734 1.740arrow_forwardFind the probability that two or more of 20 independent 95% confidence intervals does NOT contain the unknown parameter.arrow_forward
- In a survey of 700 randomly selected union members, it is found that 332 favor the republican candidate for governor. Use this to contrust the 95% confidence interval for the true population proportion of all union members who favor the republician candidate.arrow_forwardFind the p-value for a left-tailed hypothesis test with a test statistic of z= -1.25arrow_forwardWrite out the null and alternative hypotheses (making sure that your notation is understandable) and the distribution of the test statistic (but not the test statistic itself) used to address these questions.arrow_forward
- A dowser has correctly located water for a well 1 out of 2 times in Jones County. In Jones County, someone who is just guessing has a 40% chance of locating water for a well. Does this sample provide sufficient evidence that the dowser can locate water and is not just guessing?arrow_forwardFor a one-tailed (upper tail) hypothesis test with a sample size of 26 and a .01 level of significance, the critical value of the test statistic t isarrow_forwardIn 2018, a study was conducted that stated 22.6% of residents in Kern County live below the poverty line. Suppose you were hired to determine if that percentage has changed since the study was conducted. You randomly sample 200 residents from Kern County and find that 35 of them fall below the poverty line. Carry out the appropriate hypothesis test at the a = 0.05 level of significance to determine if the true proportion of Kern County residents that live below the poverty line is lower than what it was in 2018.arrow_forward
arrow_back_ios
arrow_forward_ios
Recommended textbooks for you
- MATLAB: An Introduction with ApplicationsStatisticsISBN:9781119256830Author:Amos GilatPublisher:John Wiley & Sons Inc
 Probability and Statistics for Engineering and th...StatisticsISBN:9781305251809Author:Jay L. DevorePublisher:Cengage Learning
 Statistics for The Behavioral Sciences (MindTap C...StatisticsISBN:9781305504912Author:Frederick J Gravetter, Larry B. WallnauPublisher:Cengage Learning
  Elementary Statistics: Picturing the World (7th E...StatisticsISBN:9780134683416Author:Ron Larson, Betsy FarberPublisher:PEARSON
 The Basic Practice of StatisticsStatisticsISBN:9781319042578Author:David S. Moore, William I. Notz, Michael A. FlignerPublisher:W. H. Freeman
 Introduction to the Practice of StatisticsStatisticsISBN:9781319013387Author:David S. Moore, George P. McCabe, Bruce A. CraigPublisher:W. H. Freeman
MATLAB: An Introduction with Applications
Statistics
ISBN:9781119256830
Author:Amos Gilat
Publisher:John Wiley & Sons Inc
Probability and Statistics for Engineering and th...
Statistics
ISBN:9781305251809
Author:Jay L. Devore
Publisher:Cengage Learning
Statistics for The Behavioral Sciences (MindTap C...
Statistics
ISBN:9781305504912
Author:Frederick J Gravetter, Larry B. Wallnau
Publisher:Cengage Learning
Elementary Statistics: Picturing the World (7th E...
Statistics
ISBN:9780134683416
Author:Ron Larson, Betsy Farber
Publisher:PEARSON
The Basic Practice of Statistics
Statistics
ISBN:9781319042578
Author:David S. Moore, William I. Notz, Michael A. Fligner
Publisher:W. H. Freeman
Introduction to the Practice of Statistics
Statistics
ISBN:9781319013387
Author:David S. Moore, George P. McCabe, Bruce A. Craig
Publisher:W. H. Freeman