MATLAB: An Introduction with Applications
6th Edition
ISBN: 9781119256830
Author: Amos Gilat
Publisher: John Wiley & Sons Inc
expand_more
expand_more
format_list_bulleted
Question
I am unsure how to complete this graph, any help would be great, thank you.

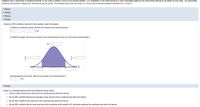
Transcribed Image Text:## Confidence Interval Activity
**Context:**
A committee is studying the waste of time in the judicial system, specifically focusing on jury duty wait times at courthouses. They surveyed 81 individuals who served as jurors, noting that the average wait time was 9 hours, with a standard deviation of 2 hours.
---
### Part (d)
**Objective:** Construct a 95% confidence interval for the population mean time wasted.
#### Steps:
1. **State the Confidence Interval:**
- Calculate and provide the interval. Round to two decimal places.
- \(\_\_\_\_.\_\_\_\_\) hrs
2. **Graph Sketching:**
- Prepare a graph with the following elements:
- A bell curve indicating a normal distribution.
- \(CL\) (Confidence Level) indicated at the top of the curve.
- \(\frac{\alpha}{2}\) values on either side, with areas shaded under the curve.
- Mean (\(\overline{X}\)) shown at the center.
3. **Calculate the Error Bound:**
- Provide the error bound. Round to two decimal places.
- \(\_\_\_\_.\_\_\_\_\) hrs
---
### Part (e)
**Explanation of Confidence Interval:**
Choose the accurate statement:
- There is a 95% chance that a wait time at the courthouse lies within this interval.
- We are 95% confident that the true population mean wait time at the courthouse lies within this interval.
- We are 95% confident that a wait time at the courthouse lies within this interval.
- We are 95% confident that the mean wait time of the sample of 81 individuals waiting at the courthouse lies within this interval.
---
This explanation and calculation will provide insights into the average time wasted by jurors, supporting decisions to potentially improve efficiency in the judicial process.
Expert Solution
This question has been solved!
Explore an expertly crafted, step-by-step solution for a thorough understanding of key concepts.
This is a popular solution
Trending nowThis is a popular solution!
Step by stepSolved in 3 steps with 1 images

Knowledge Booster
Learn more about
Need a deep-dive on the concept behind this application? Look no further. Learn more about this topic, statistics and related others by exploring similar questions and additional content below.Similar questions
arrow_back_ios
arrow_forward_ios
Recommended textbooks for you
 MATLAB: An Introduction with ApplicationsStatisticsISBN:9781119256830Author:Amos GilatPublisher:John Wiley & Sons Inc
 Probability and Statistics for Engineering and th...StatisticsISBN:9781305251809Author:Jay L. DevorePublisher:Cengage Learning
 Statistics for The Behavioral Sciences (MindTap C...StatisticsISBN:9781305504912Author:Frederick J Gravetter, Larry B. WallnauPublisher:Cengage Learning
 Elementary Statistics: Picturing the World (7th E...StatisticsISBN:9780134683416Author:Ron Larson, Betsy FarberPublisher:PEARSON
 The Basic Practice of StatisticsStatisticsISBN:9781319042578Author:David S. Moore, William I. Notz, Michael A. FlignerPublisher:W. H. Freeman
 Introduction to the Practice of StatisticsStatisticsISBN:9781319013387Author:David S. Moore, George P. McCabe, Bruce A. CraigPublisher:W. H. Freeman

MATLAB: An Introduction with Applications
Statistics
ISBN:9781119256830
Author:Amos Gilat
Publisher:John Wiley & Sons Inc

Probability and Statistics for Engineering and th...
Statistics
ISBN:9781305251809
Author:Jay L. Devore
Publisher:Cengage Learning

Statistics for The Behavioral Sciences (MindTap C...
Statistics
ISBN:9781305504912
Author:Frederick J Gravetter, Larry B. Wallnau
Publisher:Cengage Learning

Elementary Statistics: Picturing the World (7th E...
Statistics
ISBN:9780134683416
Author:Ron Larson, Betsy Farber
Publisher:PEARSON

The Basic Practice of Statistics
Statistics
ISBN:9781319042578
Author:David S. Moore, William I. Notz, Michael A. Fligner
Publisher:W. H. Freeman

Introduction to the Practice of Statistics
Statistics
ISBN:9781319013387
Author:David S. Moore, George P. McCabe, Bruce A. Craig
Publisher:W. H. Freeman