
MATLAB: An Introduction with Applications
6th Edition
ISBN: 9781119256830
Author: Amos Gilat
Publisher: John Wiley & Sons Inc
expand_more
expand_more
format_list_bulleted
Related questions
Question
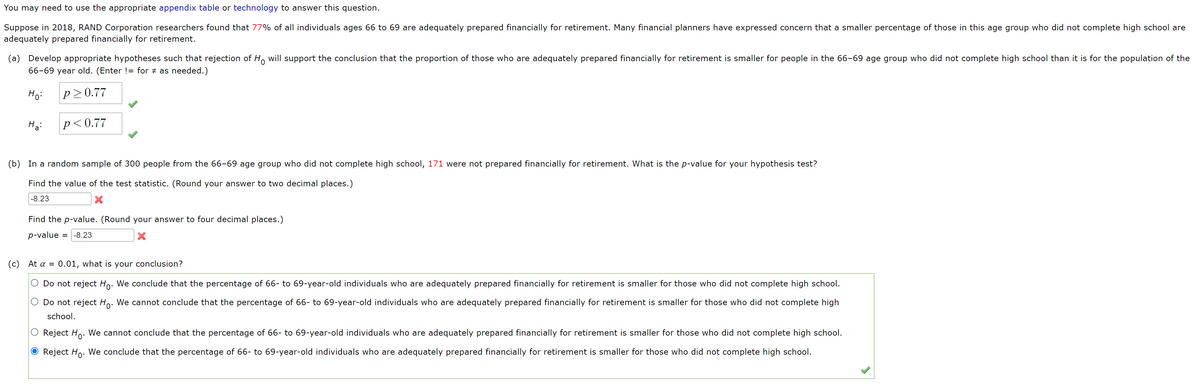

Transcribed Image Text:You may need to use the appropriate appendix table or technology to answer this question.
Suppose in 2018, RAND Corporation researchers found that 77% of all individuals ages 66 to 69 are adequately prepared financially for retirement. Many financial planners have expressed concern that a smaller percentage of those in this age group who did not complete high school are
adequately prepared financially for retirement.
(a) Develop appropriate hypotheses such that rejection of Ho will support the conclusion that the proportion of those who are adequately prepared financially for retirement is smaller for people in the 66-69 age group who did not complete high school than it is for the population of the
66-69 year old. (Enter != for ‡ as needed.)
Ho:
P≥0.77
Ha:
p<0.77
(b) In a random sample of 300 people from the 66-69 age group who did not complete high school, 171 were not prepared financially for retirement. What is the p-value for your hypothesis test?
Find the value of the test statistic. (Round your answer to two decimal places.)
-8.23
Find the p-value. (Round your answer to four decimal places.)
p-value = -8.23
X
(c) At a = 0.01, what is your conclusion?
Do not reject Ho. We conclude that the percentage of 66- to 69-year-old individuals who are adequately prepared financially for retirement is smaller for those who did not complete high school.
Do not reject Ho. We cannot conclude that the percentage of 66- to 69-year-old individuals who are adequately prepared financially for retirement is smaller for those who did not complete high
school.
Reject Ho. We cannot conclude that the percentage of 66- to 69-year-old individuals who are adequately prepared financially for retirement is smaller for those who did not complete high school.
Reject Ho. We conclude that the percentage of 66- to 69-year-old individuals who are adequately prepared financially for retirement is smaller for those who did not complete high school.
Expert Solution
This question has been solved!
Explore an expertly crafted, step-by-step solution for a thorough understanding of key concepts.

This is a popular solution

Trending nowThis is a popular solution!

Step by stepSolved in 4 steps with 1 images

Knowledge Booster

Similar questions
- In a random sample of 545 accountants engaged in preparing county operating budgets for use in planning and control, 117 indicated that estimates of cash flow were the most difficult element of the budget to derive. a. Test at the 5% level the null hypothesis that at least 25% of all accountants find cash flow estimates the most difficult estimates to derive. b. Based on the procedure used in part a, what is the probability that the null hypothesis would be rejected if the true percentage of those finding cash flow estimates most difficult was each of the following? i. 20% ii. 25% iii. 30%arrow_forwardThe National Academy of Science reported that 37% of research in mathematics is published by US authors. The mathematics chairperson of a prestigious university wishes to test the claim that this percentage is no longer 37%. He has no indication of whether the percentage has increased or decreased since that time. He surveys a simple random sample of 221 recent articles published by reputable mathematics research journals and finds that 98 of these articles have US authors. Does this evidence support the mathematics chairperson’s claim that the percentage is no longer 37%? Use a 0.05 level of significance. Step 2 of 3 : Compute the value of the test statistic. Round your answer to two decimal places.arrow_forward"Bullying," according to noted expert Dan Olweus, "poisons the educational environment and affects the learning of every child." Bullying and victimization are evident as early as preschool, with the problem peaking in middle school. Suppose you are interested in the emotional well-being of not only the victims but also bystanders, bullies, and those who bully but who are also victims (bully-victims). You decide to measure depression in a group of victims and a group of bully-victims using a 26-item, 3-point depression scale. Assume scores on the depression scale are normally distributed and that the variances of the depression scores are the same among victims and bully-victims. The group of 25 victims scored an average of 25.3 with a sample standard deviation of 9 on the depression scale. The group of 23 bully-victims scored an average of 20.5 with a sample standard deviation of 8 on the same scale. You do not have any presupposed assumptions about whether victims or bully-victims…arrow_forward
- The National Academy of Science reported that 31 % of research in mathematics is published by US authors. The mathematics chairperson of a prestigious university wishes to test the claim that this percentage is no longer 31 %. He has no indication of whether the percentage has increased or decreased since that time. He surveys a simple random sample of 188 recent articles published by reputable mathematics research journals and finds that 74 of these articles have US authors. Does this evidence support the mathematics chairperson's claim that the percentage is no longer 31 % ? Use a 0.02 level of significance. Step 1 of 3: State the null and alternative hypotheses for the test. Fill in the blank below. Answer Ho Ha P p = 0.31 000 #^ O # O > 0.31 Keypad Keyboard Shortcuts Tablesarrow_forwardIn 2018, RAND Corporation researchers found that 71% of all individuals ages 66 to 69 are adequately prepared financially for retirement. Many financial planners have expressed concern that a smaller percentage of those in this age group who did not complete high school are adequately prepared financially for retirement. a. Develop appropriate hypotheses such that rejection of Ho will support the conclusion that the proportion of those who are adequately prepared financially for retirement is smaller for people in the 66 – 69 age group who did not complete high school than it is for the population of the 66 – 69 age group. Но: р Select your answer - H: p Select your answer - b. In a random sample of 300 people from the 66 – 69 age group who did not complete high school, 165 were not prepared financially for retirement. What is the p-value for your hypothesis test (to 4 decimals)? If your answer is zero, enter "0". c. At a = 0.01, what is your conclusion? We - Select your answer - v…arrow_forward4arrow_forward
- A recent report by PEW Research Center, published on February 25, 2022 summarizes American views on Russia threat as follows. “When it comes to rising U.S.- Russia tensions, an early January survey found that 26% of Americans considered the Russian military buildup near Ukraine to be a major threat to U.S. interests, while 33% said it was a minor threat to U.S. interests. Another 7% said it was no threat at all. A relatively large share of U.S. adults (33%) said they were not sure how Russian actions toward Ukraine affected U.S. interests.” Answer the questions based on the proportions listed above. (a) Use the binomial distribution to estimate the probability that more than half of 20 randomly selected US adults consider Russian military buildup near Ukraine to be a major or a minor threat to U.S. interests. (b) Use the normal approximation to estimate the probability that more than half of 20 randomly selected US adults consider Russian military buildup near Ukraine to be a major or…arrow_forwardThe National Academy of Science reported that 33% of research in mathematics is published by US authors. The mathematics chairperson of a prestigious university wishes to test the claim that this percentage is no longer 33%. He has no indication of whether the percentage has increased or decreased since that time. He surveys a simple random sample of 280 recent articles published by reputable mathematics research journals and finds that 108 of these articles have US authors. Does this evidence support the mathematics chairperson’s claim that the percentage is no longer 33%? Use a 0.01 level of significance. Step 1 of 3 : State the null and alternative hypotheses for the test. Fill in the blank below. H0: p = 0.33 Ha: p___ 0.33arrow_forwardIn a recent survey, 32% of employed U.S. adults reported that basic mathematical skills were critical or very important to their job. The supervisor of the job placement office at a 4 year college thinks this percentage has increased due to increased use of technology in the workplace. She takes a random sample of 250 employed adults and finds that 95 of them feel that basic mathematical skills are critical or very important to their job. Is there sufficient evidence to conclude that the percentage of employed adults who feel basic mathematical skills are critical or very important to their job has increased at the a=.1 level of significance? what are the null and alternative hypotheses? determine the test statistic. Z0= ? please show work and explain how to use ti 83 calc to solvearrow_forward
- The article "Freedom of What?" (Associated Press, February 1, 2005) described a study in which high school students and high school teachers were asked whether they agreed with the following statement: "Students should be allowed to report controversial issues in their student newspapers without the approval of school authorities." Researchers hypothesized that the long-run proportion of high school teachers who would agree with the statement would differ from the long-run proportion of high school students who would agree. Two random samples - 8,000 high school teachers and 10,000 high school students were selected from high schools in the U.S. It was reported that 39% of the teachers surveyed and 58% of the students surveyed agreed with the statement. A simulated null distribution of 1,000 differences in proportions created by using the Two Proportion applet is shown below. Total shuffles - 1000 251 Number of shuffles 20 Mean -0.000 SD-0.007 LUL 0.024 -0.026 -0,016 -0.006 0.004 0.014…arrow_forwardThe National Institute of Mental Health published an article stating that in any one-year period, approximately 9.5 percent of American adults suffer from depression or a depressive illness. Suppose that in a survey of 100 people in a certain town, seven of them suffered from depression or a depressive illness. Conduct a hypothesis test to determine if the true proportion of people in that town suffering from depression or a depressive illness is lower than the percent in the general adult American population. a. Is this a test of one mean or proportion? b. State the null and alternative hypotheses. HO: c. Is this a right-tailed, left-tailed, or two-tailed test? d. What symbol represents the random variable for this test? e. In words, define the random variable for this test. f. Calculate the following: i. x = ii. n=. lii. p' = g. Calculate ox = h. State the distribution to use for the hypothesis test. i. Find the p-value. j. At a pre-conceived a = 0.05, what is your: i. Decision: ii.…arrow_forward2. A group of doctors at a specific hospital believes that the normal survival rate for patients with extensive burns will significantly increase with the use of new fluid plasma compresses. Before the new treatment, the survival rate for extensive burn patients at the hospital was about 40%. Using the new compresses, the hospital found that 48 out of 90 patients with extensive burns survived. Does this provide sufficient evidence for the hospital to try to market the new fluid plasma compresses to other hospitals? Answer this question using a = 0.05.arrow_forward
arrow_back_ios
SEE MORE QUESTIONS
arrow_forward_ios
Recommended textbooks for you
- MATLAB: An Introduction with ApplicationsStatisticsISBN:9781119256830Author:Amos GilatPublisher:John Wiley & Sons Inc
 Probability and Statistics for Engineering and th...StatisticsISBN:9781305251809Author:Jay L. DevorePublisher:Cengage Learning
 Statistics for The Behavioral Sciences (MindTap C...StatisticsISBN:9781305504912Author:Frederick J Gravetter, Larry B. WallnauPublisher:Cengage Learning
  Elementary Statistics: Picturing the World (7th E...StatisticsISBN:9780134683416Author:Ron Larson, Betsy FarberPublisher:PEARSON
 The Basic Practice of StatisticsStatisticsISBN:9781319042578Author:David S. Moore, William I. Notz, Michael A. FlignerPublisher:W. H. Freeman
 Introduction to the Practice of StatisticsStatisticsISBN:9781319013387Author:David S. Moore, George P. McCabe, Bruce A. CraigPublisher:W. H. Freeman
MATLAB: An Introduction with Applications
Statistics
ISBN:9781119256830
Author:Amos Gilat
Publisher:John Wiley & Sons Inc
Probability and Statistics for Engineering and th...
Statistics
ISBN:9781305251809
Author:Jay L. Devore
Publisher:Cengage Learning
Statistics for The Behavioral Sciences (MindTap C...
Statistics
ISBN:9781305504912
Author:Frederick J Gravetter, Larry B. Wallnau
Publisher:Cengage Learning
Elementary Statistics: Picturing the World (7th E...
Statistics
ISBN:9780134683416
Author:Ron Larson, Betsy Farber
Publisher:PEARSON
The Basic Practice of Statistics
Statistics
ISBN:9781319042578
Author:David S. Moore, William I. Notz, Michael A. Fligner
Publisher:W. H. Freeman
Introduction to the Practice of Statistics
Statistics
ISBN:9781319013387
Author:David S. Moore, George P. McCabe, Bruce A. Craig
Publisher:W. H. Freeman