MATLAB: An Introduction with Applications
6th Edition
ISBN: 9781119256830
Author: Amos Gilat
Publisher: John Wiley & Sons Inc
expand_more
expand_more
format_list_bulleted
Question

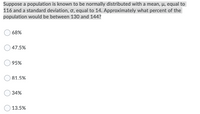
Transcribed Image Text:Suppose a population is known to be normally distributed with a mean, µ, equal to
116 and a standard deviation, ơ, equal to 14. Approximately what percent of the
population would be between 130 and 144?
68%
47.5%
95%
81.5%
34%
13.5%
Expert Solution
This question has been solved!
Explore an expertly crafted, step-by-step solution for a thorough understanding of key concepts.
Step by stepSolved in 2 steps with 2 images

Knowledge Booster
Similar questions
- In one statistics course, students reported studying an average of 9.5 hours a week, with a standard deviation of 1.5. The professor tells David his study time is at the 67th percentile. How many hours does David study each week? 8.075 O 10.16 O 10.925 8.84arrow_forwardA distribution has mean 100 and standard deviation 3. What is the largest percent of the data that is guaranteed to be between 40 and 160 93.75 96 97.44 99.75 99.99arrow_forward26)arrow_forward
- Assume that the heights of women are normally distributed with a mean of 63 inches and a standard deviation of 1.4 inches. Find Qa, the third quartile that separates the bottom 75% from the top 25%. Click to view page 1 of the table. Click to view page 2 of the table. O A. 62.1 B. 63.9 O C. 64.6 O D. 64.8arrow_forwardConsider the data from the Anthropology 105 class. The mean for women is 64.33 in and the standard deviation is 2.64 in. The average height of men in the US is approximately 5ft 10in. What proportion of women represented here are shorter than the average man?arrow_forwardScores on the Wechsler Adult Intelligence Scale for the 2020 to 3434 age group are approximately Normally distributed with a mean of 110 and a standard deviation of 15. How high must a person score to be in the top 5%5% of all scores? Enter your answer as a whole number.arrow_forward
- What is the level of measurement of the variable “age”? A. IQR B. Range C. Median D. Ordinal E. Mode F. Nominal G. Mean H. Interval/Ratio I. IQV J. Standard deviationarrow_forwardYou have a normal population with a mean of 1000 and a standard deviation of 100.Determine the scores associated with the following percentiles: 50% 45% 95% 5% 77%arrow_forwardA normally distributed data set has a mean of 100 and a standard deviation of 5. What percent of data values are bigger than 105 ? 16 % 95% 60 % 32 %arrow_forward
arrow_back_ios
arrow_forward_ios
Recommended textbooks for you
 MATLAB: An Introduction with ApplicationsStatisticsISBN:9781119256830Author:Amos GilatPublisher:John Wiley & Sons Inc
 Probability and Statistics for Engineering and th...StatisticsISBN:9781305251809Author:Jay L. DevorePublisher:Cengage Learning
 Statistics for The Behavioral Sciences (MindTap C...StatisticsISBN:9781305504912Author:Frederick J Gravetter, Larry B. WallnauPublisher:Cengage Learning
 Elementary Statistics: Picturing the World (7th E...StatisticsISBN:9780134683416Author:Ron Larson, Betsy FarberPublisher:PEARSON
 The Basic Practice of StatisticsStatisticsISBN:9781319042578Author:David S. Moore, William I. Notz, Michael A. FlignerPublisher:W. H. Freeman
 Introduction to the Practice of StatisticsStatisticsISBN:9781319013387Author:David S. Moore, George P. McCabe, Bruce A. CraigPublisher:W. H. Freeman

MATLAB: An Introduction with Applications
Statistics
ISBN:9781119256830
Author:Amos Gilat
Publisher:John Wiley & Sons Inc

Probability and Statistics for Engineering and th...
Statistics
ISBN:9781305251809
Author:Jay L. Devore
Publisher:Cengage Learning

Statistics for The Behavioral Sciences (MindTap C...
Statistics
ISBN:9781305504912
Author:Frederick J Gravetter, Larry B. Wallnau
Publisher:Cengage Learning

Elementary Statistics: Picturing the World (7th E...
Statistics
ISBN:9780134683416
Author:Ron Larson, Betsy Farber
Publisher:PEARSON

The Basic Practice of Statistics
Statistics
ISBN:9781319042578
Author:David S. Moore, William I. Notz, Michael A. Fligner
Publisher:W. H. Freeman

Introduction to the Practice of Statistics
Statistics
ISBN:9781319013387
Author:David S. Moore, George P. McCabe, Bruce A. Craig
Publisher:W. H. Freeman