
MATLAB: An Introduction with Applications
6th Edition
ISBN: 9781119256830
Author: Amos Gilat
Publisher: John Wiley & Sons Inc
expand_more
expand_more
format_list_bulleted
Related questions
Topic Video
Question
Please help solve following question ATTACHED ARE NECESSSARY ELEMETS TO SOLVE AND Multiple choice awnser please tell me which one is correct
Analysing the trend of the world's average temperature over time: data was collected between the years 1970 and 2011 (a total of 42 years). Above is computer output on the sample data (years are counted as
number of years since 1970
Assume that all conditions for inference have been met.
Select which of the followng is an appropriate test statistic for testing the null hypothesis that the
population slope in this setting is
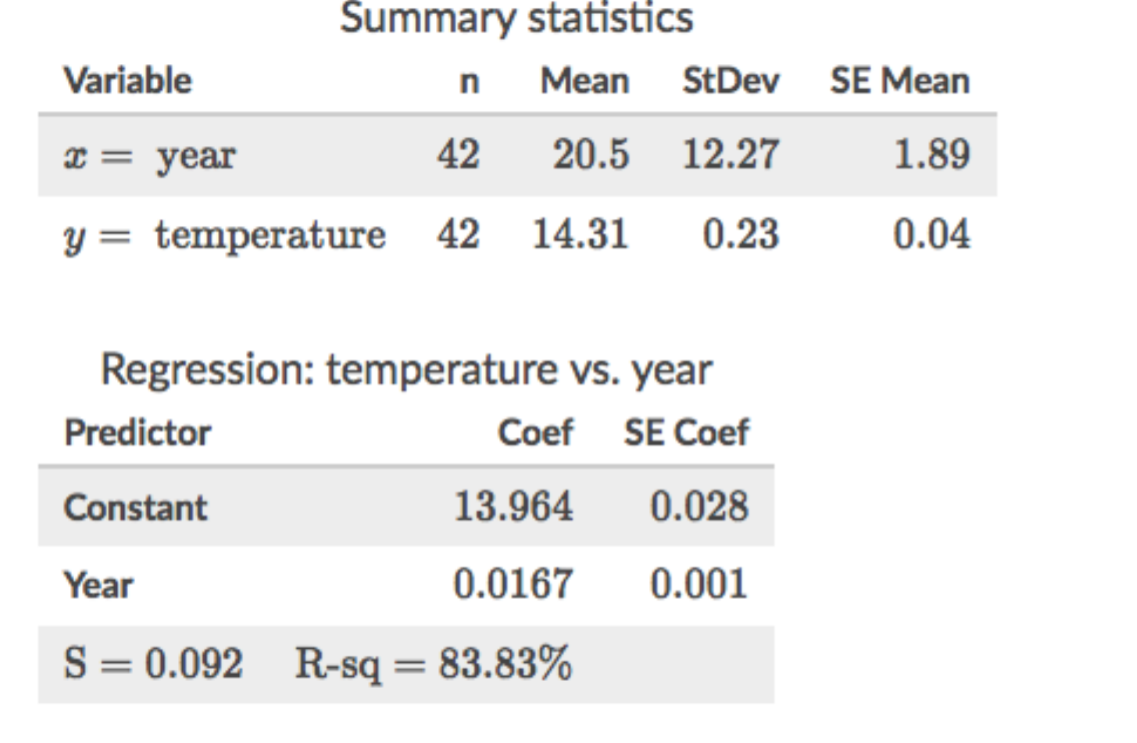

Transcribed Image Text:Summary statistics
Variable
Mean
StDev SE Mean
* = year
42
20.5
12.27
1.89
y = temperature 42 14.31
0.23
0.04
Regression: temperature vs. year
Predictor
Coef SE Coef
Constant
13.964
0.028
Year
0.0167
0.001
S= 0.092 R-sq = 83.83%

Transcribed Image Text:Select one or more:
0.0167
a. t =
0.001
20.5
b. t=
1.89
13.964
c. t=
0.028
0.0167
t =
d.
0.001
V 42
13.964
t
0.028
е.
V42
Expert Solution
This question has been solved!
Explore an expertly crafted, step-by-step solution for a thorough understanding of key concepts.

Step by stepSolved in 2 steps

Knowledge Booster


Learn more about
Need a deep-dive on the concept behind this application? Look no further. Learn more about this topic, statistics and related others by exploring similar questions and additional content below.Similar questions
- r ps://www.capit. State Water Reso... New Tab 5 https://usonyc.ta... The National Longitudinal Study of Adolescent Health interviewed several thousand teens (grades 7 to 12). One question asked was "What do you think are the chances you will be married in the next 10 years?" Here is a two-way table of the responses by gender: Opinion Almost no chance Some chance but probably not A 50-50 chance A good chance. Almost certain Female Male 129 115 145 185 427 498 739 710 1188 756 a. How many individuals are described in this table? b. How many females were among the respondents? c. The percent of females among the respondents was about d. Your percent from the previous exercise is part of O the marginal distribution of sex. O the marginal distribution of opinion about marriage. O the conditional distribution of sex among adolescents with a given opinion. e. What percent of females thought that they were almost certain to be married in the next 10 years?arrow_forwardThe entering SAT scores and high school GPA’s of 100 first-year students and their grade point averages after one year at college are recorded. What type of statistical analysis is most appropriate if you want to use the data to make predictions on the college GPA for next year’s entering class. Assume the data is normal. Name of Test _____________________________________________arrow_forwardHi there, please help me with this statistic homework which very important. please please please help me with it. however provided in the first image is the scater gragh and the second image is an introduction. please help me and Thank you soo much! these are questions that require to be done: This involves linking components of the statistical enquiry cycle to the context, and referring to evidence such as statistics, data values, trends, or features of visual displays in support of statements made. 1): Pose an appropriate relationship question which is informed by research, and described the nature and strength of the relationship and related this to the context. 2): The description of the features has need to be justified by evidence from the data and displays, and the residuals have needs to support the comments on the appropriateness of the linear model. 3): The also needs to be link with the components of the statistical enquiry cycle to the context when communicating findings in…arrow_forward
- Question 1 The marks of 7 math students were recorded. Find the sample standard deviation. 61, 64, 65, 72, 78, 81, 86 (x - x)² Step 1) Find the sample mean X = Step 2) Make a table and calculate (x-x)² Step 3) Add up all the values you just found. Step 4) Plug this into the standard deviation formula. Math Mark (x) Σ(x-x)² =arrow_forwardplease complete the requirement and complete making frequency didtribution tally sheet and a histogram of the measurement from dtat given in table: please make them on computer and explain how you made them. To summarize do reauirements 1,2,3.arrow_forwardWhat is the mean speed now? What is the new standard deviation? The new mean would be 6.276.27 mph. The new standard deviation would be 5.855.85 mph. (Type integers or decimals rounded to two decimal places as needed.) Part 2 b) The homeowner's friend lives in another region and wants to study the speeds, so the homeowner converts all the original miles-per-hour readings to kilometers per hour by multiplying all speeds by 1.6091.609 (km per mile). What is the mean now? What is the new standard deviation? The mean speed is 58.3658.36 kph. The standard deviation is 9.419.41 kph.arrow_forward
- A research study investigates the occurrence of extra heartbeats between untrained and trained older patients at risk for heart attack. Researchers decide to test whether there is a significant difference in the number of extra beats depending on training status. They obtain measurements over 10 minutes, summarized below. What did they find? If there is a significant difference, how big of one is there? (Provide a range.) dfadi = 25 (if needed) Status # patients Untrained 43 Mean # extra beats/10 min 72.46 32.35 Standard Deviation Minimum # extra beats Maximum # of extra beats Skew Kurtosis 28 165 -0.21 0.62 Trained 21 169.50 62.93 66 266 0.13 -0.1arrow_forwardThe number of cans of soft drinks sold in a machine each week is recorded below. Develop forecasts for the period indicated and error calculations 155, 145, 155, 162, 180, 165, 172, 149, 170, 172 Naïve Method What is the forecast for week 10? What is the Mean Absolute Error (MAE)?arrow_forwardPlease read the article and answer one of the following questions from the screenshot I will provide thank youarrow_forward
- Investigation 4: Tempo Differences Between Genres Now we will consider if the difference in the mean tempos between the genres EDM (electronic dance music) and rock is significant. The data set is provided on the blackboard as a .csv file called Tempo4. We are subtracting (EDM – rock) when calculating the difference. Total of EDM Songs: 640 Total of Rock Songs: 512 a) Obtain the value of the observed statistic used to estimate the parameter using StatKey or Rguroo. Upload your data set to either program to obtain your statistic and state the statistic rounded to one decimal place as your answer to this part. b) Define the parameter of interest in context using the symbol(s) and words in one sentence.c) State the null and alternative hypotheses using correct notation. d) Create a bootstrap distribution by following these instructions. In StatKey, go to the middle pane labeled ‘Bootstrap Confidence Interval’ and click CI for Difference in Means. Upload the file in ‘Upload…arrow_forwardConsidering salary of employee's in a company, the mean salary of managers is $102,000 per year. Is this number a statistic or parameter?arrow_forwardPlease solve the screenshot and use tables from Google as needed!arrow_forward
arrow_back_ios
SEE MORE QUESTIONS
arrow_forward_ios
Recommended textbooks for you
- MATLAB: An Introduction with ApplicationsStatisticsISBN:9781119256830Author:Amos GilatPublisher:John Wiley & Sons Inc
 Probability and Statistics for Engineering and th...StatisticsISBN:9781305251809Author:Jay L. DevorePublisher:Cengage Learning
 Statistics for The Behavioral Sciences (MindTap C...StatisticsISBN:9781305504912Author:Frederick J Gravetter, Larry B. WallnauPublisher:Cengage Learning
  Elementary Statistics: Picturing the World (7th E...StatisticsISBN:9780134683416Author:Ron Larson, Betsy FarberPublisher:PEARSON
 The Basic Practice of StatisticsStatisticsISBN:9781319042578Author:David S. Moore, William I. Notz, Michael A. FlignerPublisher:W. H. Freeman
 Introduction to the Practice of StatisticsStatisticsISBN:9781319013387Author:David S. Moore, George P. McCabe, Bruce A. CraigPublisher:W. H. Freeman
MATLAB: An Introduction with Applications
Statistics
ISBN:9781119256830
Author:Amos Gilat
Publisher:John Wiley & Sons Inc
Probability and Statistics for Engineering and th...
Statistics
ISBN:9781305251809
Author:Jay L. Devore
Publisher:Cengage Learning
Statistics for The Behavioral Sciences (MindTap C...
Statistics
ISBN:9781305504912
Author:Frederick J Gravetter, Larry B. Wallnau
Publisher:Cengage Learning
Elementary Statistics: Picturing the World (7th E...
Statistics
ISBN:9780134683416
Author:Ron Larson, Betsy Farber
Publisher:PEARSON
The Basic Practice of Statistics
Statistics
ISBN:9781319042578
Author:David S. Moore, William I. Notz, Michael A. Fligner
Publisher:W. H. Freeman
Introduction to the Practice of Statistics
Statistics
ISBN:9781319013387
Author:David S. Moore, George P. McCabe, Bruce A. Craig
Publisher:W. H. Freeman