MATLAB: An Introduction with Applications
6th Edition
ISBN: 9781119256830
Author: Amos Gilat
Publisher: John Wiley & Sons Inc
expand_more
expand_more
format_list_bulleted
Topic Video
Question
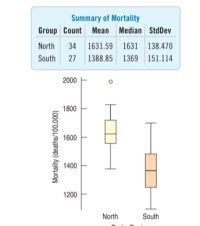
Hard water II The data set from England and Wales
also notes for each town whether it was south or north of
also notes for each town whether it was south or north of
Derby. Here are some summary statistics and a compara-
tive boxplot for the two regions.a) What is the overall mean mortality rate for the two
regions?
b) Do you see evidence of a difference in mortality
rates? Explain.
tive boxplot for the two regions.a) What is the overall mean mortality rate for the two
regions?
b) Do you see evidence of a difference in mortality
rates? Explain.

Transcribed Image Text:Summary of Mortality
Group Count Mean Median StdDev
North
34 1631.59 1631 138.470
South
27 1388.85 1369 151.114
2000
1800
1600
1400
1200
North
South
Mortality (deaths/100,000)
Expert Solution
This question has been solved!
Explore an expertly crafted, step-by-step solution for a thorough understanding of key concepts.
This is a popular solution
Trending nowThis is a popular solution!
Step by stepSolved in 2 steps with 2 images

Knowledge Booster
Learn more about
Need a deep-dive on the concept behind this application? Look no further. Learn more about this topic, statistics and related others by exploring similar questions and additional content below.Similar questions
- 1.Please read and complete currently this is a review.arrow_forward2. Critique the data display below. Would you recommend a different display? Percentage of children ages 7 to 10 meeting dietary recommendations 50 40 30 20 10 Milk Grains Vegetables Fruits Meat Total fat Percentagearrow_forwardThe purpose of this assignment is to learn to organize and present statistical data by using frequency distribution. You need to know how to get the number of class, class interval, and class limits. For quantitative data, get frequency distribution, relative frequency, percent frequency, and cumulative frequency. Refer to the table attached and answer the following questions: Comment on the shape of the distribution. Interpret the pattern of how CEOs spend their day in meetings. Upload the final frequency distribution table.arrow_forward
- Typed and correct answer please. I will rate accordingly.arrow_forwardIf a data set has 15 mean standard daviation 2 , percentage observation lie between 13 and 17arrow_forwardGasoline tax. find the mean, median, and mode for the data in the following table. (source: American Petroleum Institute.) State Gasoline Tax, 2017 STATE TAX(CENTS PER GAL.) winsconsin 32.9 new york 43.9 connecticut 39.9 nebraska 28.2 kansas 24.0 texas 20.0 california 38.1 tennessee 21.4arrow_forward
- Can someone please help? Thank you.arrow_forwardA congressperson wants to come up with a single value to describe the prices of homes in their district. However, their district consists of a few homes that are extremely expensive compared to the others. Which descriptive statistic should they use? a. Range b. Mode c. Median d. Meanarrow_forwardThe following refer to the following data set: 20 28 44 92 64 48 68 43 86 43 What is the mean (7) of this data set? mean = (Please show your answer to one decimal place.) What is the median of this data set? median = %3D What is the mode of this data set? mode = %3Darrow_forward
- Erik, a driver of a courier motorcycle, recorded the distances he travelled (in kilometres) on 15 trips. The data is given below: 26 26 22 27 28 14 8 21 7 27 11 10 7 22 25 Question 1 What is the median for the above-mentioned data? Calculation step: Median = Write down the upper and lower quartiles. THANK YOU!!!arrow_forwardIf a data set has an even number of observations, the medianarrow_forwardThe following refer to the following data set: 24 35 98 30 91 40 93 40 57 39 What is the mean () of this data set? mean = (Please show your answer to one decimal place.) What is the median of this data set? median = What is the mode of this data set? mode =arrow_forward
arrow_back_ios
SEE MORE QUESTIONS
arrow_forward_ios
Recommended textbooks for you
 MATLAB: An Introduction with ApplicationsStatisticsISBN:9781119256830Author:Amos GilatPublisher:John Wiley & Sons Inc
 Probability and Statistics for Engineering and th...StatisticsISBN:9781305251809Author:Jay L. DevorePublisher:Cengage Learning
 Statistics for The Behavioral Sciences (MindTap C...StatisticsISBN:9781305504912Author:Frederick J Gravetter, Larry B. WallnauPublisher:Cengage Learning
 Elementary Statistics: Picturing the World (7th E...StatisticsISBN:9780134683416Author:Ron Larson, Betsy FarberPublisher:PEARSON
 The Basic Practice of StatisticsStatisticsISBN:9781319042578Author:David S. Moore, William I. Notz, Michael A. FlignerPublisher:W. H. Freeman
 Introduction to the Practice of StatisticsStatisticsISBN:9781319013387Author:David S. Moore, George P. McCabe, Bruce A. CraigPublisher:W. H. Freeman

MATLAB: An Introduction with Applications
Statistics
ISBN:9781119256830
Author:Amos Gilat
Publisher:John Wiley & Sons Inc

Probability and Statistics for Engineering and th...
Statistics
ISBN:9781305251809
Author:Jay L. Devore
Publisher:Cengage Learning

Statistics for The Behavioral Sciences (MindTap C...
Statistics
ISBN:9781305504912
Author:Frederick J Gravetter, Larry B. Wallnau
Publisher:Cengage Learning

Elementary Statistics: Picturing the World (7th E...
Statistics
ISBN:9780134683416
Author:Ron Larson, Betsy Farber
Publisher:PEARSON

The Basic Practice of Statistics
Statistics
ISBN:9781319042578
Author:David S. Moore, William I. Notz, Michael A. Fligner
Publisher:W. H. Freeman

Introduction to the Practice of Statistics
Statistics
ISBN:9781319013387
Author:David S. Moore, George P. McCabe, Bruce A. Craig
Publisher:W. H. Freeman