
MATLAB: An Introduction with Applications
6th Edition
ISBN: 9781119256830
Author: Amos Gilat
Publisher: John Wiley & Sons Inc
expand_more
expand_more
format_list_bulleted
Related questions
Question
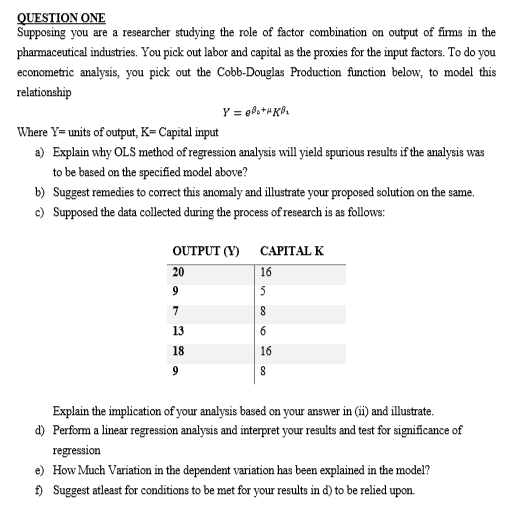

Transcribed Image Text:QUESTION ONE
Supposing you are a researcher studying the role of factor combination on output of firms in the
pharmaceutical industries. You pick out labor and capital as the proxies for the input factors. To do you
econometric analysis, you pick out the Cobb-Douglas Production function below, to model this
relationship
Y = @Bo+HKB₁
Where Y= units of output, K= Capital input
a) Explain why OLS method of regression analysis will yield spurious results if the analysis was
to be based on the specified model above?
b) Suggest remedies to correct this anomaly and illustrate your proposed solution on the same.
c) Supposed the data collected during the process of research is as follows:
OUTPUT (Y)
CAPITAL K
20
16
9
5
7
8
13
6
18
16
9
8
Explain the implication of your analysis based on your answer in (ii) and illustrate.
d) Perform a linear regression analysis and interpret your results and test for significance of
regression
e) How Much Variation in the dependent variation has been explained in the model?
f) Suggest atleast for conditions to be met for your results in d) to be relied upon.
Expert Solution
This question has been solved!
Explore an expertly crafted, step-by-step solution for a thorough understanding of key concepts.

This is a popular solution

Trending nowThis is a popular solution!

Step by stepSolved in 3 steps

Follow-up Questions
Read through expert solutions to related follow-up questions below.
Follow-up Question
Suggest remedies to correct this anomaly and illustrate your proposed solution on the
same
Solution
by Bartleby Expert
Follow-up Questions
Read through expert solutions to related follow-up questions below.
Follow-up Question
Suggest remedies to correct this anomaly and illustrate your proposed solution on the
same
Solution
by Bartleby Expert
Knowledge Booster

Similar questions
- Which model appears to be the best accordingly? A. Model I B. Model II C. Model III D. Model IVarrow_forwardThe table below show data that has been collected from different fields from various farms in a certain valley. The table contains the grams of Raspberries tested and the amount of their Vitamin C content in mg. Find a linear model that express Vitamin C content as a function of the weight of the Raspberries. grams Vitamin C content in mg 55 11.9 60 13.7 65 15.9 70 18.5 75 20.8 80 23 85 25.8 A) Find the regression equation: places y= + Round your answers to 3 decimal B) Answer the following questions using your un-rounded regression equation. If we test 115 grams of raspberries what is the expected Vitamin C content? nearest tenth) mg (round to thearrow_forwardYummy Lunch Restaurant needs to decide the most profitable location for their business expansion. Marketing manager plans to use a multiple regression model to achieve their target. His model considers yearly revenue as the dependent variable. He found that number of people within 2KM (People), Mean household income(income), no of competitors and price as explanatory variables of company yearly revenue. The following is the descriptive statistics and regression output from Excel. Revenue People Income Competitors Price Mean 343965.68 5970.26 41522.96 2.8 5.68 Standard Error 5307.89863 139.0845281 582.1376385 0.142857 0.051030203 Median 345166.5 6032 41339.5 3 5.75 Mode #N/A 5917 #N/A 3 6 Standard Deviation 37532.51115 983.47613 4116.334718 1.010153 0.360838027 Sample Variance 1408689393 967225.2984 16944211.51 1.020408 0.130204082 Sum 17198284 298513 2076148…arrow_forward
- The table below show data that has been collected from different fields from various farms in a certain valley. The table contains the grams of Raspberries tested and the amount of their Vitamin C content in mg. Find a linear model that express Vitamin C content as a function of the weight of the Raspberries. grams 50 60 70 80 90 100 110 Vitamin C content in mg 9.3 14.3 18.9 23.5 27.5 31.7 36.9 A) Find the regression equation: y = places x + Round your answers to 3 decimal B) Answer the following questions using your un-rounded regression equation. If we test 140 grams of raspberries what is the expected Vitamin C content? nearest tenth) mg (round to thearrow_forwardRange of ankle motion is a contributing factor to falls among the elderly. Suppose a team of researchers is studying how compression hosiery, typical shoes, and medical shoes affect range of ankle motion. In particular, note the variables Barefoot and Footwear2. Barefoot represents a subject's range of ankle motion (in degrees) while barefoot, and Footwear2 represents their range of ankle motion (in degrees) while wearing medical shoes. Use this data and your preferred software to calculate the equation of the least-squares linear regression line to predict a subject's range of ankle motion while wearing medical shoes, ?̂ , based on their range of ankle motion while barefoot, ? . Round your coefficients to two decimal places of precision. ?̂ = A physical therapist determines that her patient Jan has a range of ankle motion of 7.26°7.26° while barefoot. Predict Jan's range of ankle motion while wearing medical shoes, ?̂ . Round your answer to two decimal places. ?̂ = Suppose Jan's…arrow_forward
arrow_back_ios
arrow_forward_ios
Recommended textbooks for you
- MATLAB: An Introduction with ApplicationsStatisticsISBN:9781119256830Author:Amos GilatPublisher:John Wiley & Sons Inc
 Probability and Statistics for Engineering and th...StatisticsISBN:9781305251809Author:Jay L. DevorePublisher:Cengage Learning
 Statistics for The Behavioral Sciences (MindTap C...StatisticsISBN:9781305504912Author:Frederick J Gravetter, Larry B. WallnauPublisher:Cengage Learning
  Elementary Statistics: Picturing the World (7th E...StatisticsISBN:9780134683416Author:Ron Larson, Betsy FarberPublisher:PEARSON
 The Basic Practice of StatisticsStatisticsISBN:9781319042578Author:David S. Moore, William I. Notz, Michael A. FlignerPublisher:W. H. Freeman
 Introduction to the Practice of StatisticsStatisticsISBN:9781319013387Author:David S. Moore, George P. McCabe, Bruce A. CraigPublisher:W. H. Freeman
MATLAB: An Introduction with Applications
Statistics
ISBN:9781119256830
Author:Amos Gilat
Publisher:John Wiley & Sons Inc
Probability and Statistics for Engineering and th...
Statistics
ISBN:9781305251809
Author:Jay L. Devore
Publisher:Cengage Learning
Statistics for The Behavioral Sciences (MindTap C...
Statistics
ISBN:9781305504912
Author:Frederick J Gravetter, Larry B. Wallnau
Publisher:Cengage Learning
Elementary Statistics: Picturing the World (7th E...
Statistics
ISBN:9780134683416
Author:Ron Larson, Betsy Farber
Publisher:PEARSON
The Basic Practice of Statistics
Statistics
ISBN:9781319042578
Author:David S. Moore, William I. Notz, Michael A. Fligner
Publisher:W. H. Freeman
Introduction to the Practice of Statistics
Statistics
ISBN:9781319013387
Author:David S. Moore, George P. McCabe, Bruce A. Craig
Publisher:W. H. Freeman