
Understanding Business
12th Edition
ISBN: 9781259929434
Author: William Nickels
Publisher: McGraw-Hill Education
expand_more
expand_more
format_list_bulleted
Related questions
Question
Uppp
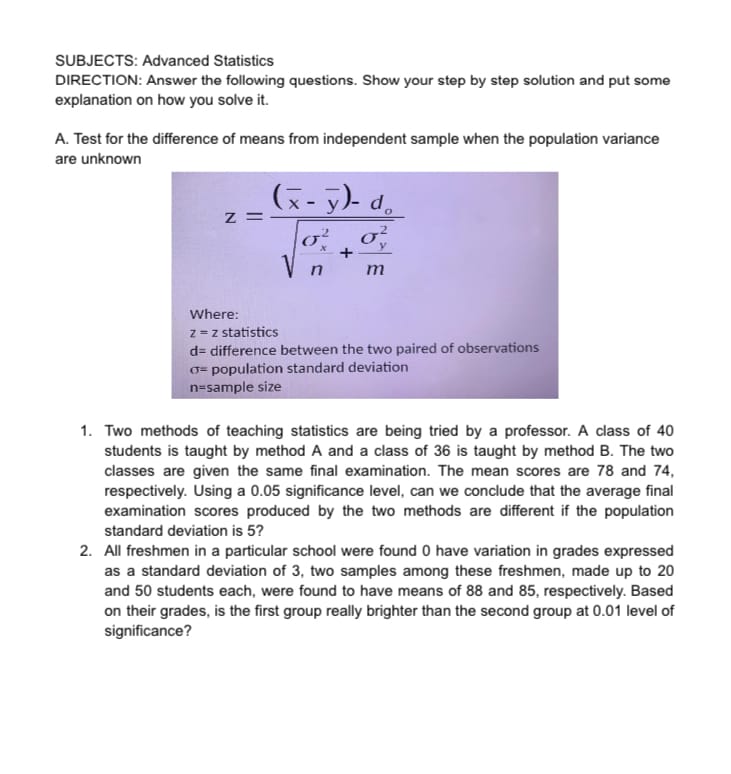

Transcribed Image Text:SUBJECTS: Advanced Statistics
DIRECTION: Answer the following questions. Show your step by step solution and put some
explanation on how you solve it.
A. Test for the difference of means from independent sample when the population variance
are unknown
Z =
(x- y)- do
σε στ
n
m
Where:
z = z statistics
d= difference between the two paired of observations
σ=population standard deviation
n-sample size
1. Two methods of teaching statistics are being tried by a professor. A class of 40
students is taught by method A and a class of 36 is taught by method B. The two
classes are given the same final examination. The mean scores are 78 and 74,
respectively. Using a 0.05 significance level, can we conclude that the average final
examination scores produced by the two methods are different if the population
standard deviation is 5?
2. All freshmen in a particular school were found 0 have variation in grades expressed
as a standard deviation of 3, two samples among these freshmen, made up to 20
and 50 students each, were found to have means of 88 and 85, respectively. Based
on their grades, is the first group really brighter than the second group at 0.01 level of
significance?

Transcribed Image Text:B. Test for the difference of means from independent samples when the population variance
is unknown and the sample are more than 30.
Z.
(x-y)- d
V n
S
+
m
Where:
z = z statistics
d= difference between the two paired of observations
s-sample standard deviation
n & m -sample size
1. The average grade of 50 senior students in statistics is 85 with a standard deviation
of 10.2, while a group of 60 senior students got an average of 80 with standard
deviation of 8.9. Can the difference in the mean grade be attributed to chance, using
0.05 level of significance?
2. A women's group claims that female college graduates who go to work were paid
less than their male counterparts. They cite the results of a study of 1995 college
graduates who went to work immediately upon graduation. A total of 32 women are
currently making a mean salary of 85,952 with a standard deviation of 1,328, while
40 male graduates are currently making an average of 92,328 with a standard
deviation of 809, obtain a 99% confidence interval of the true difference in mean
salary for men and women. Does the result substantiate the women's group's claim?
Expert Solution
This question has been solved!
Explore an expertly crafted, step-by-step solution for a thorough understanding of key concepts.

Step by stepSolved in 2 steps

Knowledge Booster

Similar questions
- 云 < cO # 3 QUESTION 6 A measure of the importance of trade is: OA. Trade as a percentage of employment rate. OB. Trade as percentage of GDP. O C. The dollar value of trade adjusted for inflation. OD. The real value of trade. QUESTION 7 given goods A and B and a budget , if the relative price of A were to increase, the budget line would: A. Shift out in parallel fashion. OB. Shift in a relative fashion. C. Become steeper. OD.Become flatter OUESTION8 MAR 12 tv 08 F3 F2 DD F7 F4 F5 F6 F8 24 2. ) 9 7. 6arrow_forward~ his ozas and an is my 节 站 12arrow_forwardPlease do not give solution in image format thankuarrow_forward
- WindCo Inc. owns several delivery vans that could be sold very quickly in the event that the company runs into financial trouble. These delivery vans should be considered ______. Question 38 options: A) long-term assets B) fixed assets C) current assets D) current liabilities E) accounts receivablearrow_forwardwhat is an example of a latent demandarrow_forwardPrice Quantity Demanded LRAC 50 1 $10 35 $20 20 $24 4 $37.50 The table above shows demand and average total cost for a natural monopoly firm. What will the price will this firm charge? $20 $50 $35 $5arrow_forward
- Question 5 Catherine purchased a segregated fund 12 years ago with a 10-year maturity and death benefit guarantee. She has conducted no transactions since then, and when she looks at her annual statement, she realizes that the market value of her fund is higher than the guarantee. She starts checking her annual statements of previous years and realizes for the first time that the market value in the 10th year was below the guarantee to which she was entitled. Is Catherine entitled to the guarantee top-up for the 10th year of the contract? a) Yes, it was automatically deposited in her account b) Yes, but it will be paid only on expiration of the contract c) No, because it's too late to claim d) No, there was no disposition to this effect.arrow_forwardWhat is “safety stock”? What does safety stock provide safetyagainst?arrow_forward1 - Which revenue model is based on a 130 year old practice that stemmed from door to door sales people and direct mailings? Fee for Transaction Advertising Fee-for-Content Web Catalogarrow_forward
arrow_back_ios
SEE MORE QUESTIONS
arrow_forward_ios
Recommended textbooks for you
- Understanding BusinessManagementISBN:9781259929434Author:William NickelsPublisher:McGraw-Hill Education
 Management (14th Edition)ManagementISBN:9780134527604Author:Stephen P. Robbins, Mary A. CoulterPublisher:PEARSON
 Spreadsheet Modeling & Decision Analysis: A Pract...ManagementISBN:9781305947412Author:Cliff RagsdalePublisher:Cengage Learning
  Management Information Systems: Managing The Digi...ManagementISBN:9780135191798Author:Kenneth C. Laudon, Jane P. LaudonPublisher:PEARSON
 Business Essentials (12th Edition) (What's New in...ManagementISBN:9780134728391Author:Ronald J. Ebert, Ricky W. GriffinPublisher:PEARSON
 Fundamentals of Management (10th Edition)ManagementISBN:9780134237473Author:Stephen P. Robbins, Mary A. Coulter, David A. De CenzoPublisher:PEARSON
Understanding Business
Management
ISBN:9781259929434
Author:William Nickels
Publisher:McGraw-Hill Education
Management (14th Edition)
Management
ISBN:9780134527604
Author:Stephen P. Robbins, Mary A. Coulter
Publisher:PEARSON
Spreadsheet Modeling & Decision Analysis: A Pract...
Management
ISBN:9781305947412
Author:Cliff Ragsdale
Publisher:Cengage Learning
Management Information Systems: Managing The Digi...
Management
ISBN:9780135191798
Author:Kenneth C. Laudon, Jane P. Laudon
Publisher:PEARSON
Business Essentials (12th Edition) (What's New in...
Management
ISBN:9780134728391
Author:Ronald J. Ebert, Ricky W. Griffin
Publisher:PEARSON
Fundamentals of Management (10th Edition)
Management
ISBN:9780134237473
Author:Stephen P. Robbins, Mary A. Coulter, David A. De Cenzo
Publisher:PEARSON