
MATLAB: An Introduction with Applications
6th Edition
ISBN: 9781119256830
Author: Amos Gilat
Publisher: John Wiley & Sons Inc
expand_more
expand_more
format_list_bulleted
Related questions
Topic Video
Question
In need of a tutor, not confident I understand how to complete practice task. Please help
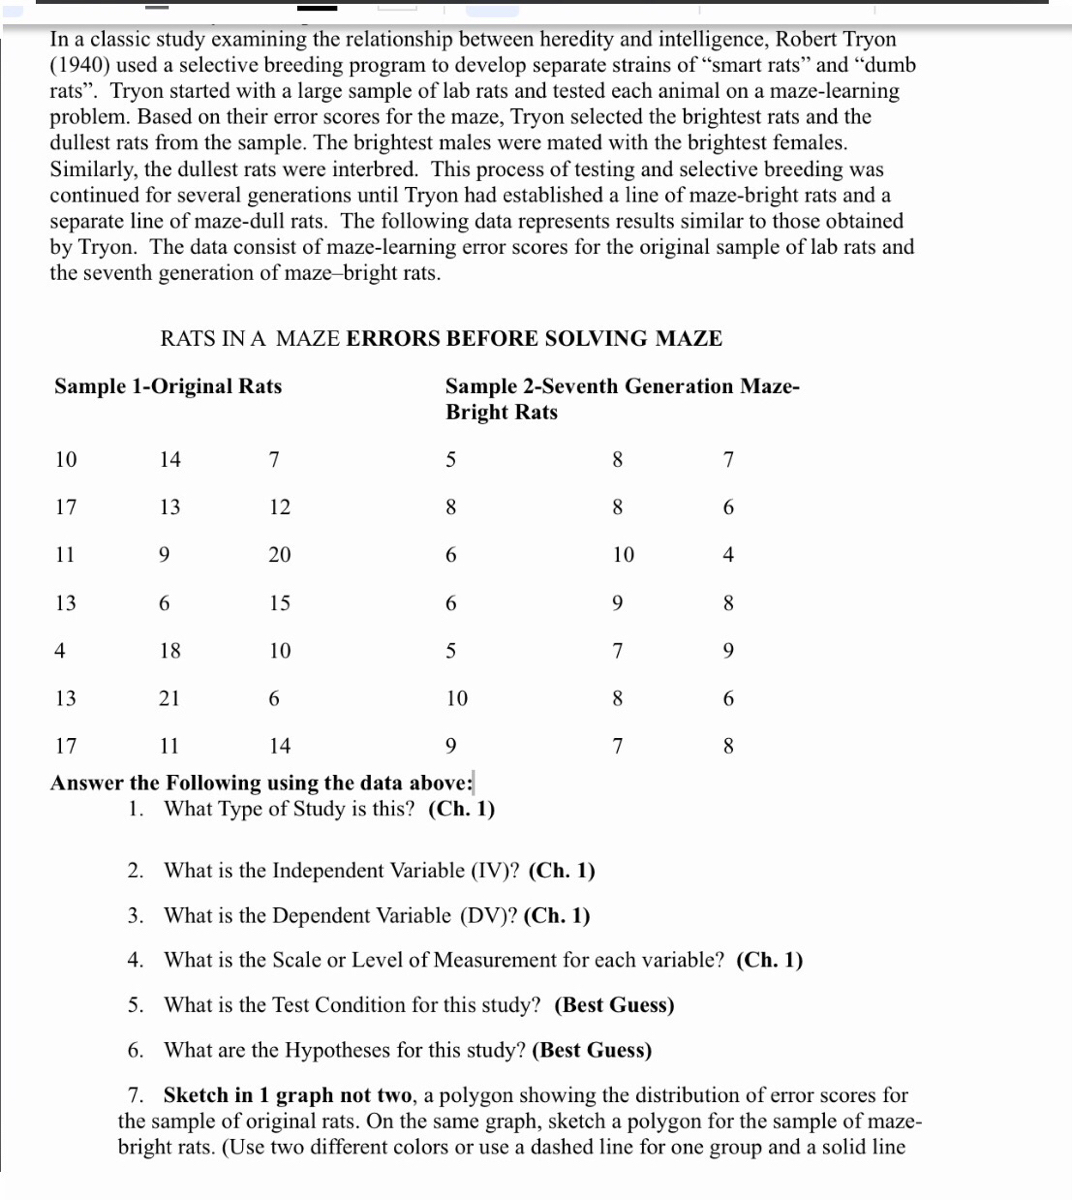

Transcribed Image Text:In a classic study examining the relationship between heredity and intelligence, Robert Tryon
(1940) used a selective breeding program to develop separate strains of "smart rats" and "dumb
rats". Tryon started with a large sample of lab rats and tested each animal on a maze-learning
problem. Based on their error scores for the maze, Tryon selected the brightest rats and the
dullest rats from the sample. The brightest males were mated with the brightest females.
Similarly, the dullest rats were interbred. This process of testing and selective breeding was
continued for several generations until Tryon had established a line of maze-bright rats and a
separate line of maze-dull rats. The following data represents results similar to those obtained
by Tryon. The data consist of maze-learning error scores for the original sample of lab rats and
the seventh generation of maze-bright rats.
RATS IN A MAZE ERRORS BEFORE SOLVING MAZE
Sample 2-Seventh Generation Maze-
Bright Rats
Sample 1-Original Rats
10
14
7
7
17
13
12
8
8.
6.
11
9.
20
6.
10
4
13
6.
15
6.
9.
8
4
18
10
7
9.
13
21
6.
10
8.
6.
17
11
14
9.
7
8
Answer the Following using the data above:
1. What Type of Study is this? (Ch. 1)
2. What is the Independent Variable (IV)? (Ch. 1)
3. What is the Dependent Variable (DV)? (Ch. 1)
4. What is the Scale or Level of Measurement for each variable? (Ch. 1)
5. What is the Test Condition for this study? (Best Guess)
6. What are the Hypotheses for this study? (Best Guess)
7. Sketch in 1 graph not two, a polygon showing the distribution of error scores for
the sample of original rats. On the same graph, sketch a polygon for the sample of maze-
bright rats. (Use two different colors or use a dashed line for one group and a solid line

Transcribed Image Text:for the other group.) Based on the graph, describe the differences between the two
samples. (Ch. 2)
8. Calculate the mean error score for each sample. Does the mean difference support
your description from #7? Interpret your results in complete sentences. (Ch.3)
9. Calculate the variance and standard deviation for each sample. Based on the
measures of dispersion or variability, Is one group more diverse than the other? Is one
group more homogeneous that the other? Interpret your results. (Ch. 4)
10. Find the Q1, Median, Q3, IQR for each sample. (Ch. 4)
11.
Create a boxplot for each sample! See YouTube Video INTRO TO BOX AND
WHISKER PLOTS!
Expert Solution
This question has been solved!
Explore an expertly crafted, step-by-step solution for a thorough understanding of key concepts.

This is a popular solution

Trending nowThis is a popular solution!

Step by stepSolved in 3 steps

Knowledge Booster


Learn more about
Need a deep-dive on the concept behind this application? Look no further. Learn more about this topic, statistics and related others by exploring similar questions and additional content below.Similar questions
- I am not quite sure what you did in this question even though the answer is right. Is it possible to use a pen instead of typing ? That can be a great help. Thanks.arrow_forwardI was doing my homework but look for an example but I don't know how they get the class midpointarrow_forwardoptions for drop down menu are also included. not sure how to solve this onearrow_forward
arrow_back_ios
arrow_forward_ios
Recommended textbooks for you
- MATLAB: An Introduction with ApplicationsStatisticsISBN:9781119256830Author:Amos GilatPublisher:John Wiley & Sons Inc
 Probability and Statistics for Engineering and th...StatisticsISBN:9781305251809Author:Jay L. DevorePublisher:Cengage Learning
 Statistics for The Behavioral Sciences (MindTap C...StatisticsISBN:9781305504912Author:Frederick J Gravetter, Larry B. WallnauPublisher:Cengage Learning
  Elementary Statistics: Picturing the World (7th E...StatisticsISBN:9780134683416Author:Ron Larson, Betsy FarberPublisher:PEARSON
 The Basic Practice of StatisticsStatisticsISBN:9781319042578Author:David S. Moore, William I. Notz, Michael A. FlignerPublisher:W. H. Freeman
 Introduction to the Practice of StatisticsStatisticsISBN:9781319013387Author:David S. Moore, George P. McCabe, Bruce A. CraigPublisher:W. H. Freeman
MATLAB: An Introduction with Applications
Statistics
ISBN:9781119256830
Author:Amos Gilat
Publisher:John Wiley & Sons Inc
Probability and Statistics for Engineering and th...
Statistics
ISBN:9781305251809
Author:Jay L. Devore
Publisher:Cengage Learning
Statistics for The Behavioral Sciences (MindTap C...
Statistics
ISBN:9781305504912
Author:Frederick J Gravetter, Larry B. Wallnau
Publisher:Cengage Learning
Elementary Statistics: Picturing the World (7th E...
Statistics
ISBN:9780134683416
Author:Ron Larson, Betsy Farber
Publisher:PEARSON
The Basic Practice of Statistics
Statistics
ISBN:9781319042578
Author:David S. Moore, William I. Notz, Michael A. Fligner
Publisher:W. H. Freeman
Introduction to the Practice of Statistics
Statistics
ISBN:9781319013387
Author:David S. Moore, George P. McCabe, Bruce A. Craig
Publisher:W. H. Freeman