
A First Course in Probability (10th Edition)
10th Edition
ISBN: 9780134753119
Author: Sheldon Ross
Publisher: PEARSON
expand_more
expand_more
format_list_bulleted
Related questions
Question
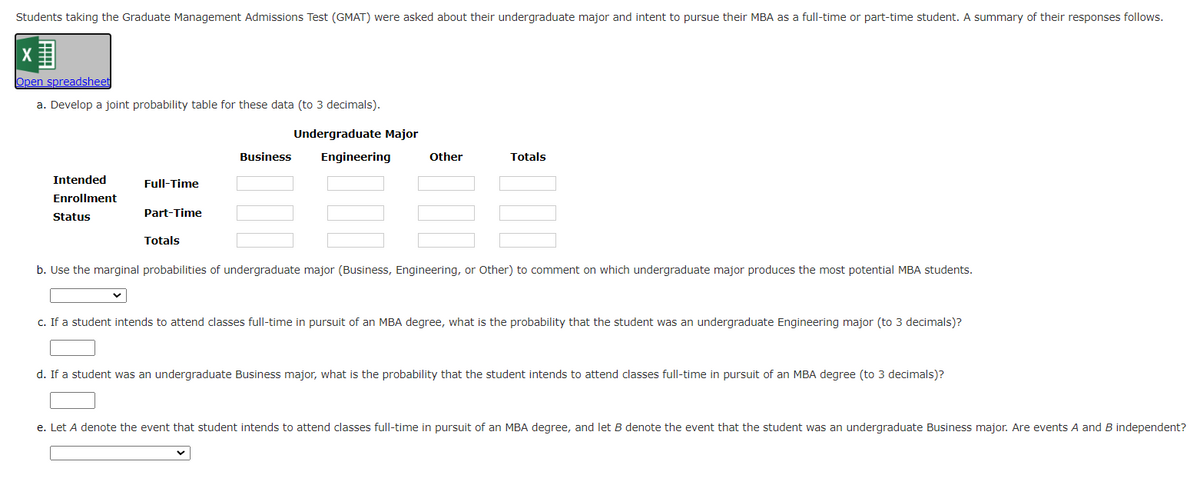

Transcribed Image Text:Students taking the Graduate Management Admissions Test (GMAT) were asked about their undergraduate major and intent to pursue their MBA as a full-time or part-time student. A summary of their responses follows.
X
Open spreadsheet
a. Develop a joint probability table for these data (to 3 decimals).
Undergraduate Major
Business
Engineering
Other
Totals
Intended
Enrollment
Status
Full-Time
Part-Time
Totals
b. Use the marginal probabilities of undergraduate major (Business, Engineering, or Other) to comment on which undergraduate major produces the most potential MBA students.
c. If a student intends to attend classes full-time in pursuit of an MBA degree, what is the probability that the student was an undergraduate Engineering major (to 3 decimals)?
d. If a student was an undergraduate Business major, what is the probability that the student intends to attend classes full-time in pursuit of an MBA degree (to 3 decimals)?
e. Let A denote the event that student intends to attend classes full-time in pursuit of an MBA degree, and let B denote the event that the student was an undergraduate Business major. Are events A and B independent?

Transcribed Image Text:Full Time
Part Time
Totals
Full Time
Part Time
Totals
Part C:
Undergraduate Major
Business Engineering Other
423
401
824
Totals
392
75
890
594
44
1039
986
119
1929
Develop a joint probability table for these data in the blue cells.
Place your values in the green cells (to 3 decimals).
Part A: Joint Probability Table
Business
Part A: Formulas Used
Engineering Other
Totals
Business
Engineering
Other
Totals
Full Time
#N/A
#N/A
#N/A
#N/A
Part Time
#N/A
#N/A
#N/A
#N/A
Totals
#N/A
#N/A
#N/A
#N/A
Part C:
#N/A
Part D:
#N/A
Part D:
Question Prompts for Parts C & D
Part C
If a student intends to attend classes full-time in pursuit of an MBA degree, what is the probability that the student was an undergraduate Engineering major (to 3 decimals)?
Part D
If a student was an undergraduate Business major, what is the probability that the student intends to attend classes full-time in pursuit of an MBA degree (to 3 decimals)?
Expert Solution
This question has been solved!
Explore an expertly crafted, step-by-step solution for a thorough understanding of key concepts.

This is a popular solution

Trending nowThis is a popular solution!

Step by stepSolved in 2 steps with 3 images

Knowledge Booster

Similar questions
- Please answer all thoroughly and clearly Grade 12 Data Managementarrow_forwardAnswer #30 please. Show work.arrow_forwardAt a particular college 19 percent of the students major in business. All business majors are required to take a statistics course. Of the students not majoring in business, 31 percent of them still have to take a statistics course. What is the probability that a student has to take a statistics course at this particular college? Type your answer as a decimal to 4 decimal places.arrow_forward
- Please see attachment belowarrow_forwardCreate a probability distribution table for your data. Data: 0.20, 0.20, 0.46, 0.46, 2.10, 2.10, 5.50, 11.80, 12.20, 12.20, 13.22, 14.65, 16.07, 17.49, 18.91, 20.33, 20.50, 20.50, 21.75, 23.18arrow_forwardThe second slide is the first part of the question and the first slide is the second part of the questionarrow_forward
- A daycare provider has determined that 80% of the children in her care develop colds each winter. This year there are 40 children at the daycare. What is the probability that fewer than 30 children will develops colds this winter? Please explain. Options A. 0.2148 B. 0.2852 C. 0.5704 D. 0.4297arrow_forwardUse the dataset of GPAs below to calculate the tail probability of a GPA of 1.3. You should use a calculator to help you. GPAs: 3.0, 1.2, 4.0, 3.9, 3.8, 3.0, 2.7, 2.3, 1.9, 4.0, 1.9, 1.1 Write your answer as a number between 0 and 1, where 0 is 0% and 1 is 100%. Round your answer to three decimal places.arrow_forwardClaim: Most adults would erase all of their personal information online if they could. A software firm survey of 410 randomly selected adults showed that 57% of them would erase all of their personal information online if they could. Find the value of the test statistic.arrow_forward
- Below is a partially complete probability model. Enter the probability for the final outcome. Outcome 3 3 3.5 6 Probability 0.35 0.2 0.15 Find the expected value of the probability model. Speakarrow_forwardInstructor-created question Question Help v Fran is taking a multiple choice quiz with 4 questions. Each question has 5 choices including exactly 1 correct answer. There is no partial credit. If Fran is just guessing: (a) How many questions can Fran expect to get right? Exact decimal answer: (b) What is the probability that Fran gets at least 70% passing? Exact decimal answer: brrect: 0 Enter your answer in the edit fields and then click Check Answer. All parts showing Clear All Check Answer O v O 12:13arrow_forward74.2% of people pass their driving test. Suppose you are trying to get your license. Find the probability you pass on the 3rd try.arrow_forward
arrow_back_ios
arrow_forward_ios
Recommended textbooks for you
- A First Course in Probability (10th Edition)ProbabilityISBN:9780134753119Author:Sheldon RossPublisher:PEARSON

A First Course in Probability (10th Edition)
Probability
ISBN:9780134753119
Author:Sheldon Ross
Publisher:PEARSON