MATLAB: An Introduction with Applications
6th Edition
ISBN: 9781119256830
Author: Amos Gilat
Publisher: John Wiley & Sons Inc
expand_more
expand_more
format_list_bulleted
Question

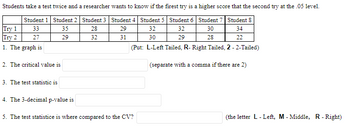
Transcribed Image Text:Students take a test twice and a researcher wants to know if the firest try is a higher score that the second try at the .05 level.
Student 1 Student 2
Student 3 Student 4
Student 5
Student 6
Student 7 Student 8
33
35
28
29
32
32
30
34
27
29
32
31
30
29
28
22
(Put: L-Left Tailed, R- Right Tailed, 2 - 2-Tailed)
(separate with a comma if there are 2)
Try 1
Try 2
1. The graph is
2. The critical value is
3. The test statistic is
4. The 3-decimal p-value is
5. The test statistice is where compared to the CV?
(the letter L - Left, M - Middle, R-Right)
Expert Solution
This question has been solved!
Explore an expertly crafted, step-by-step solution for a thorough understanding of key concepts.
Step by stepSolved in 6 steps with 1 images

Knowledge Booster
Similar questions
- A strong positive correlation means: the points in a scatter diagram lie on a downward sloping line O the points in a scatter diagram lie on an upward sloping line O ris close to -1 O ris close to 1arrow_forwardB₁ is an estimator of B₁ a. True O b. Falsearrow_forwardWhich of the following are required to use the t test (remember there is both the variable you are testing and the grouping variable)? a. An Interval variable b. A Dichotomous variable c. Neither a nor b d. Both a and barrow_forward
- The following is a list of 14 measurements. -1, -38, -59, -12, −5, −77, −42, −50, −68, −62, −82, −9, −80, 42 Send data to calculator Suppose that these 14 measurements are respectively labeled x₁, x2, X₁4. (Thus, −1 is labeled x₁, -38 is labeled .x₂, and so on.) Compute the following. 14 Σ (*; -48) i=1 0 Xarrow_forwardPls help ASAP ON ALL PARTSarrow_forwardEamine the computation formula for r, the sample correlation cofficient. (a) in the formula for r, t we exchange the symbols xand y, do we get a ciferert result or do we get the same (equivalent) result? Eplain your answer. O The resut is different because the formula is dependent on the symbois. O The resut is dimferent because the formula is not dependent on the symbols. O The resut is the same because the formula is dependent on the symbois. • The resut is the same because the formula is not dependent on the symbols. (b) we have a set of x and y data values and we exchange comesponding x and y values to get a new data set, should the sample comrelation coefficient be the same for both sets of cata? Explain your answer O The resut is the same because the formula is dependent on which values are the x values and which values are the y values. O The resut is different because the formua is not dependent on which values are the x values and which values are the y values. • The resut is…arrow_forward
- Using the data in the first image can you give me answers to questions in 2nd image(4,5,6).Can you plz atleast explain how to do 5&6 (6 is the main one) plz help......arrow_forwardCOMMUNITY PHARMACY 127th St In F of Marle (212) 926-7500 Fax (212) 426-5900 www.harian.com RHOOD PHARMACY m Southern X o Mail-Ald X W W3Scho X W' Exercise X 10 # of movies Frequency 0 1 Twenty-three randomly selected students were asked the number of movies they watched the previous week. The results are as follows. 2 3 4 4 Number of Movies Watched 9 6 3 Welcom 1 NCC-1701 X + V a. Select the correct histogram of the data, where a value is counted in a class interval if it falls on the left boundary, but not if it falls on the right boundary. ☐arrow_forwardWeek 4 3 2 1 Lisa's Race Times Miles 1 1 1 1 Time 15 min 14 min 12 min 15 min Which shows the mean race time? Back 15 +14+ 12 + 15 12 (15 + 14 + 12 + 15) + 4 15 × 14 × 12 x 15 × (4) Narrow_forward
arrow_back_ios
arrow_forward_ios
Recommended textbooks for you
 MATLAB: An Introduction with ApplicationsStatisticsISBN:9781119256830Author:Amos GilatPublisher:John Wiley & Sons Inc
 Probability and Statistics for Engineering and th...StatisticsISBN:9781305251809Author:Jay L. DevorePublisher:Cengage Learning
 Statistics for The Behavioral Sciences (MindTap C...StatisticsISBN:9781305504912Author:Frederick J Gravetter, Larry B. WallnauPublisher:Cengage Learning
 Elementary Statistics: Picturing the World (7th E...StatisticsISBN:9780134683416Author:Ron Larson, Betsy FarberPublisher:PEARSON
 The Basic Practice of StatisticsStatisticsISBN:9781319042578Author:David S. Moore, William I. Notz, Michael A. FlignerPublisher:W. H. Freeman
 Introduction to the Practice of StatisticsStatisticsISBN:9781319013387Author:David S. Moore, George P. McCabe, Bruce A. CraigPublisher:W. H. Freeman

MATLAB: An Introduction with Applications
Statistics
ISBN:9781119256830
Author:Amos Gilat
Publisher:John Wiley & Sons Inc

Probability and Statistics for Engineering and th...
Statistics
ISBN:9781305251809
Author:Jay L. Devore
Publisher:Cengage Learning

Statistics for The Behavioral Sciences (MindTap C...
Statistics
ISBN:9781305504912
Author:Frederick J Gravetter, Larry B. Wallnau
Publisher:Cengage Learning

Elementary Statistics: Picturing the World (7th E...
Statistics
ISBN:9780134683416
Author:Ron Larson, Betsy Farber
Publisher:PEARSON

The Basic Practice of Statistics
Statistics
ISBN:9781319042578
Author:David S. Moore, William I. Notz, Michael A. Fligner
Publisher:W. H. Freeman

Introduction to the Practice of Statistics
Statistics
ISBN:9781319013387
Author:David S. Moore, George P. McCabe, Bruce A. Craig
Publisher:W. H. Freeman