
MATLAB: An Introduction with Applications
6th Edition
ISBN: 9781119256830
Author: Amos Gilat
Publisher: John Wiley & Sons Inc
expand_more
expand_more
format_list_bulleted
Related questions
Question

Transcribed Image Text:2.
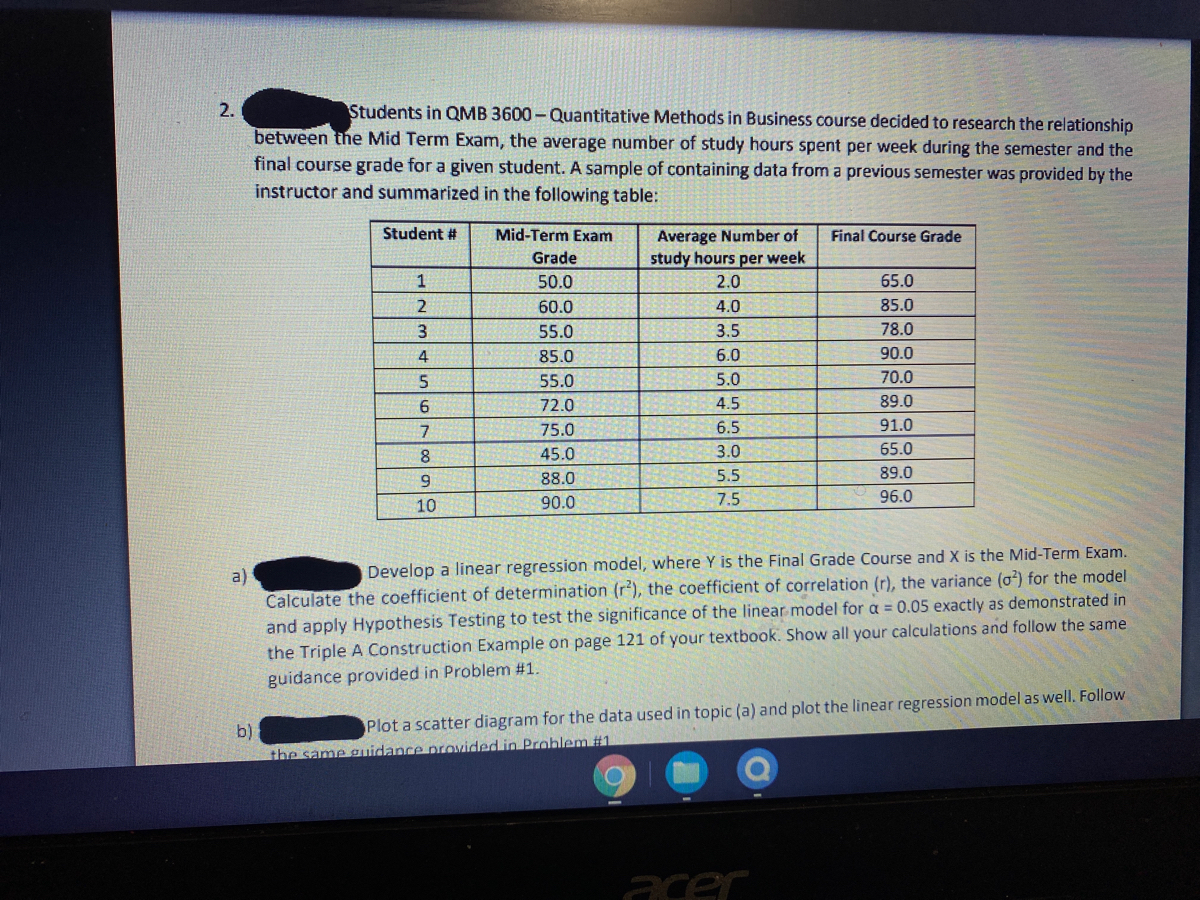
Students in QMB 3600 - Quantitative Methods in Business course decided to research the relationship
between the Mid Term Exam, the average number of study hours spent per week during the semester and the
final course grade for a given student. A sample of containing data from a previous semester was provided by the
instructor and summarized in the following table:
Student #
Average Number of
study hours per week
Mid-Term Exam
Final Course Grade
Grade
1
50.0
2.0
65.0
60.0
4.0
85.0
3.
55.0
3.5
78.0
4
85.0
6.0
90.0
5
55.0
5.0
70.0
72.0
4.5
89.0
7
75.0
6.5
91.0
8.
45.0
3.0
65.0
88.0
5.5
89.0
10
90.0
7.5
96.0
Develop a linear regression model, where Y is the Final Grade Course and X is the Mid-Term Exam.
a)
Calculate the coefficient of determination (r), the coefficient of correlation (r), the variance (o) for the model
and apply Hypothesis Testing to test the significance of the linear model for a = 0.05 exactly as demonstrated in
the Triple A Construction Example on page 121 of your textbook. Show all your calculations and follow the same
guidance provided in Problem #1.
Plot a scatter diagram for the data used in topic (a) and plot the linear regression model as well. Follow
b)
the same guidance proided in Problem #1
acer

Transcribed Image Text:os/u-7d5fb 570a2de7bb8f997c321ec3d3f511b53d7b4/MyFiles/CDownloads/QMB%203600-97216%20Fal|%202021%20-%20Rodri-
es- Chapter 4 Problems.pdf
212
100
Develop a linear regression model, where Y is the Final Grade Course and X is the Mid-Term Exam.
Calculate the coefficient of determination (r), the coefficient of correlation (r), the variance (o) for the model
and apply Hypothesis Testing to test the significance of the linear model for a = 0.05 exactly as demonstrated in
the Triple A Construction Example on page 121 of your textbook. Show all your calculations and follow the same
guidance provided in Problem #1.
b)
Plot a scatter diagram for the data used in topic (a) and plot the linear regression model as well. Follow
the same guidance provided in Problem #1.
c)
Study Hours per week. Calculate the coefficient of determination (r'), the coefficient of correlation (r), the variance
(o') for the model and apply Hypothesis Testing to test the significance of the linear model for a = 0.05 exactly as
demonstrated in the Triple A Construction Example on page 121 of your textbook. Show all your calculations and
follow the same guidance provided in Problem #1.
Develop a linear regression model, where Y is the Final Grade Course and X is the Average Number of
d)
Plot a scatter diagram for the data used in topic (c) and plot the linear regression model as well. Follow
the same guidance provided in Problem #1.
e)
Based on the coefficient of determination (r) for each linear regression models developed, which of
the two linearregression models should be used to predict the Final Grade in QMB 3600 and explain your
decision.
Expert Solution
This question has been solved!
Explore an expertly crafted, step-by-step solution for a thorough understanding of key concepts.

This is a popular solution

Trending nowThis is a popular solution!

Step by stepSolved in 3 steps with 3 images

Knowledge Booster

Similar questions
- You may need to use the appropriate appendix table or technology to answer this question. In a study entitled How Undergraduate Students Use Credit Cards, it was reported that undergraduate students have a mean credit card balance of $3,173. This figure was an all-time high and had increased 44% over the previous five years. Assume that a current study is being conducted to determine if it can be concluded that the mean credit card balance for undergraduate students has continued to increase compared to the original report. Based on previous studies, use a population standard deviation ? = $1,000. (a) State the null and alternative hypotheses. H0: ? < 3,173 Ha: ? ≥ 3,173 H0: ? = 3,173 Ha: ? ≠ 3,173 H0: ? > 3,173 Ha: ? ≤ 3,173 H0: ? ≥ 3,173 Ha: ? < 3,173 H0: ? ≤ 3,173 Ha: ? > 3,173 (b) What is the test statistic for a sample of 170 undergraduate students with a sample mean credit card balance of $3,305? (Round your answer to two decimal places.) What is…arrow_forwardWhy is Data literacy important when evaluating sources from a study?arrow_forwardDoes the process of statistical analysis stop at the end of the analysis?arrow_forward
- Binary, or Yes/No data are easily summarized numerically with median proportion sum Opi chartarrow_forwardWhy is it important to understand statistics when assessing and designing research?arrow_forwardQ1]. [30%] The data for this question given in the table below come from the sample data folder of MINITAB. The data give you the monthly number of people employed (in units of 1000) in the retail trade industry in the state of Wisconsin from January 1970 to December 1974. Copy this timeseries data into an excel spreadsheet in your home area first before you start your analysis. You can use Excel to answer this question. Month 1970 1971 1972 1973 1974 1 322 322 330 348 361 2 317 318 326 345 354 3 319 320 329 349 357 4 323 326 337 355 367 5 327 332 345 362 376 6 328 334 350 367 381 7 325 335 351 366 381 8 326 336 354 370 383 9 330 335 355 371 384 10 334 338 357 375 387 11 337 342 362 380 392 12 341 348 368 385 396 (a) (b) (c) (d) Draw a time series plot of the data and comment on any noticeable patterns. Describe an appropriate time series model for this data, giving your reasons, and obtain estimates of the components of your model using the decomposition method. Using your model…arrow_forward
arrow_back_ios
arrow_forward_ios
Recommended textbooks for you
- MATLAB: An Introduction with ApplicationsStatisticsISBN:9781119256830Author:Amos GilatPublisher:John Wiley & Sons Inc
 Probability and Statistics for Engineering and th...StatisticsISBN:9781305251809Author:Jay L. DevorePublisher:Cengage Learning
 Statistics for The Behavioral Sciences (MindTap C...StatisticsISBN:9781305504912Author:Frederick J Gravetter, Larry B. WallnauPublisher:Cengage Learning
  Elementary Statistics: Picturing the World (7th E...StatisticsISBN:9780134683416Author:Ron Larson, Betsy FarberPublisher:PEARSON
 The Basic Practice of StatisticsStatisticsISBN:9781319042578Author:David S. Moore, William I. Notz, Michael A. FlignerPublisher:W. H. Freeman
 Introduction to the Practice of StatisticsStatisticsISBN:9781319013387Author:David S. Moore, George P. McCabe, Bruce A. CraigPublisher:W. H. Freeman
MATLAB: An Introduction with Applications
Statistics
ISBN:9781119256830
Author:Amos Gilat
Publisher:John Wiley & Sons Inc
Probability and Statistics for Engineering and th...
Statistics
ISBN:9781305251809
Author:Jay L. Devore
Publisher:Cengage Learning
Statistics for The Behavioral Sciences (MindTap C...
Statistics
ISBN:9781305504912
Author:Frederick J Gravetter, Larry B. Wallnau
Publisher:Cengage Learning
Elementary Statistics: Picturing the World (7th E...
Statistics
ISBN:9780134683416
Author:Ron Larson, Betsy Farber
Publisher:PEARSON
The Basic Practice of Statistics
Statistics
ISBN:9781319042578
Author:David S. Moore, William I. Notz, Michael A. Fligner
Publisher:W. H. Freeman
Introduction to the Practice of Statistics
Statistics
ISBN:9781319013387
Author:David S. Moore, George P. McCabe, Bruce A. Craig
Publisher:W. H. Freeman