
MATLAB: An Introduction with Applications
6th Edition
ISBN: 9781119256830
Author: Amos Gilat
Publisher: John Wiley & Sons Inc
expand_more
expand_more
format_list_bulleted
Related questions
Question
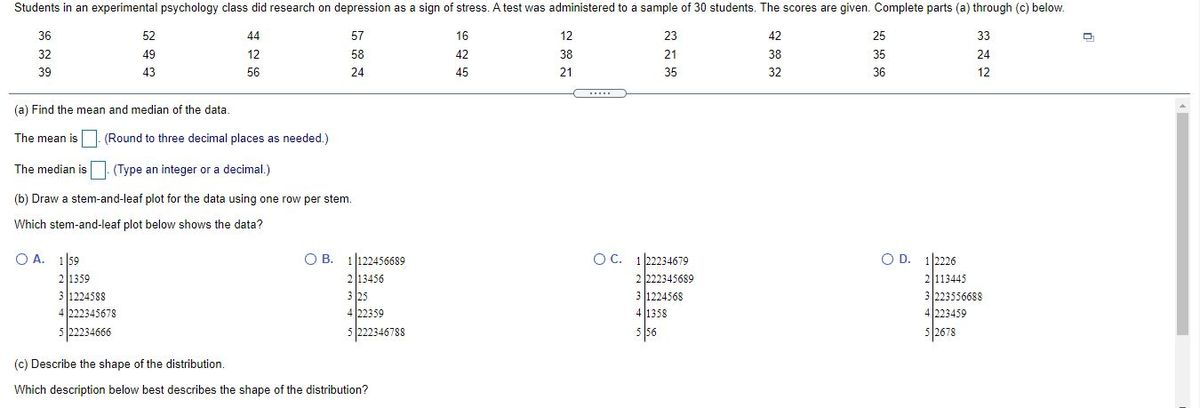

Transcribed Image Text:Students in an experimental psychology class did research on depression as a sign of stress. A test was administered to a sample of 30 students. The scores are given. Complete parts (a) through (c) below.
36
52
44
57
16
12
23
42
25
33
32
49
12
58
42
38
21
38
35
24
39
43
56
24
45
21
35
32
36
12
.....
(a) Find the mean and median of the data
The mean is (Round to three decimal places as needed.)
The median is
(Type an integer or a decimal.)
(b) Draw a stem-and-leaf plot for the data using one row per stem.
Which stem-and-leaf plot below shows the data?
O A. 1 59
O B. 1122456689
213456
3 25
4 22359
5 222346788
OC. 1 2234679
2 222345689
3 1224568
4 1358
5 56
O D. 12226
2113445
3 223556688
21359
3 1224588
4 222345678
4223459
5/22234666
5 2678
5
(c) Describe the shape of the distribution.
Which description below best describes the shape of the distribution?

Transcribed Image Text:(c) Describe the shape of the distribution.
Which description below best describes the shape of the distribution?
O A. The distribution is symmetric.
O B. The distribution is uniform.
OC. The distribution is skewed left (negatively skewed).
O D. The distribution is skewed right (positively skewed).
Expert Solution
This question has been solved!
Explore an expertly crafted, step-by-step solution for a thorough understanding of key concepts.

This is a popular solution

Trending nowThis is a popular solution!

Step by stepSolved in 4 steps

Knowledge Booster

Similar questions
- Mrs. Rhee gave a unit exam to her Statistics students. The data set below shows the percent score that each of the students received. Data: Unit Exam Scores 82 55 86 64 69 91 98 98 54 52 85 83 61 59 100 87 94 62 51 67 Display this data in a stemplot Use your stemplot in part a) to describe the distribution of scores Why would it be misleading to only report a measure of center for Mrs. Rhee’s distribution of scores?arrow_forwardAge of residents in a neighbourhood 26 45 27 50 40 52 12 28 48 52 14 20 32 9 36 10 36 51 42 1 30 21 40 37 13 35 57 47 42 53 Create a box-and-whisker plot for the data. What is the sample standard deviation of the data set? Use IQR and the standard deviation to determine if there are any outliers in the data set. I am unsure of my answer for the last question as I got IQR= 26 and - 18 and 85 when I inputed the numbers for itarrow_forwardA survey has been conducted recently to study the hourly wages of part-time employees at the Food Delivery services sector. The result was organized into the following frequency distribution. Hourly Wages Number of Part-time Employees $40 − less than $50 12 $50 − less than $60 26 $60 − less than $70 35 $70 − less than $80 17 $80 − less than $90 8 $90 − less than $100 2 (i) Calculate the mean, mode and standard deviation of the hourly wages. (ii) Calculate the coefficient of variation. (iii) If the median is equal to 64, calculate Pearson’s 2nd coefficient of skewness and interpret your answer briefly. (iv) The government wants to carry out similar survey next year. If the error of a point estimate of the mean is not more than $1.5, use the 97% confidence level to determine the sample size required to achieve this error.arrow_forward
- Students in an experimental psychology class did research on depression as a sign of stress. A test was administered to a sample of 30 students. The scores are given. Complete parts (a) through (c) below. 32 54 11 15 35 21 OA. 158 34 15 55 51 11 35 2 1457 3 1234567 4123445566 511245666 34 33 46 OB. 11155 (a) Find the mean and median of the data. The mean is . (Round to three decimal places as needed.) 44 26 27 The median is .(Type an integer or a decimal.) (b) Draw a stem-and-leaf plot for the data using one row per stem. Which stem-and-leaf plot below shows the data? 2 112677 3 233445556 4 244666 5 1456 ... 21 42 38 OA. The distribution is symmetric. B. The distribution is skewed right (positively skewed). OC. The distribution is skewed left (negatively skewed). O D. The distribution is uniform. (c) Describe the shape of the distribution. Which description below best describes the shape of the distribution? 56 46 OC. 1112455668 2 14556 3 15 4 13457 5 223446667 46 27 33 35 22 44 36 0…arrow_forwardAn experiment was conducted to determine if exposure to an advertisement would change attitude toward a product. Each subject’s attitude before and after exposure to the advertisement was recorded, using a valid ten point scale. The results indicated: Subject Attitude Post Exposure Attitude Pre Exposure 1 6 4 2 8 5 3 6 6 4 4 3 5 7 2 6 6 3 7 9 6 8 7 6 9 8 5 10 8 6 Set up hypotheses and test to determine if the mean attitude toward the product increased as a result of exposure to the advertisement. (Note: these samples must be regarded as dependent, as each subject served as both a control (pre-exposure) and a treatment (post exposure). Fully interpret your result.arrow_forwardThe following table shows the distribution of scores on a final elementary statistics examination for a large section of students. 0.12 The cumulative relative frequency for the class 60-70 (i.e. what percentage of students scored 70 or lower) is 0.06 0.57 Classes for Exam Scores 90 and over 80-90 70 - 80 60-70 50 - 60 40 - 50 Under 40 0.43 Number of Students 5 12 40 18 13 6 6arrow_forward
arrow_back_ios
arrow_forward_ios
Recommended textbooks for you
- MATLAB: An Introduction with ApplicationsStatisticsISBN:9781119256830Author:Amos GilatPublisher:John Wiley & Sons Inc
 Probability and Statistics for Engineering and th...StatisticsISBN:9781305251809Author:Jay L. DevorePublisher:Cengage Learning
 Statistics for The Behavioral Sciences (MindTap C...StatisticsISBN:9781305504912Author:Frederick J Gravetter, Larry B. WallnauPublisher:Cengage Learning
  Elementary Statistics: Picturing the World (7th E...StatisticsISBN:9780134683416Author:Ron Larson, Betsy FarberPublisher:PEARSON
 The Basic Practice of StatisticsStatisticsISBN:9781319042578Author:David S. Moore, William I. Notz, Michael A. FlignerPublisher:W. H. Freeman
 Introduction to the Practice of StatisticsStatisticsISBN:9781319013387Author:David S. Moore, George P. McCabe, Bruce A. CraigPublisher:W. H. Freeman
MATLAB: An Introduction with Applications
Statistics
ISBN:9781119256830
Author:Amos Gilat
Publisher:John Wiley & Sons Inc
Probability and Statistics for Engineering and th...
Statistics
ISBN:9781305251809
Author:Jay L. Devore
Publisher:Cengage Learning
Statistics for The Behavioral Sciences (MindTap C...
Statistics
ISBN:9781305504912
Author:Frederick J Gravetter, Larry B. Wallnau
Publisher:Cengage Learning
Elementary Statistics: Picturing the World (7th E...
Statistics
ISBN:9780134683416
Author:Ron Larson, Betsy Farber
Publisher:PEARSON
The Basic Practice of Statistics
Statistics
ISBN:9781319042578
Author:David S. Moore, William I. Notz, Michael A. Fligner
Publisher:W. H. Freeman
Introduction to the Practice of Statistics
Statistics
ISBN:9781319013387
Author:David S. Moore, George P. McCabe, Bruce A. Craig
Publisher:W. H. Freeman