
MATLAB: An Introduction with Applications
6th Edition
ISBN: 9781119256830
Author: Amos Gilat
Publisher: John Wiley & Sons Inc
expand_more
expand_more
format_list_bulleted
Related questions
Question
Identify the null and alternative hypotheses, test statistic, P-value,
and state the final conclusion that addresses the original claim.
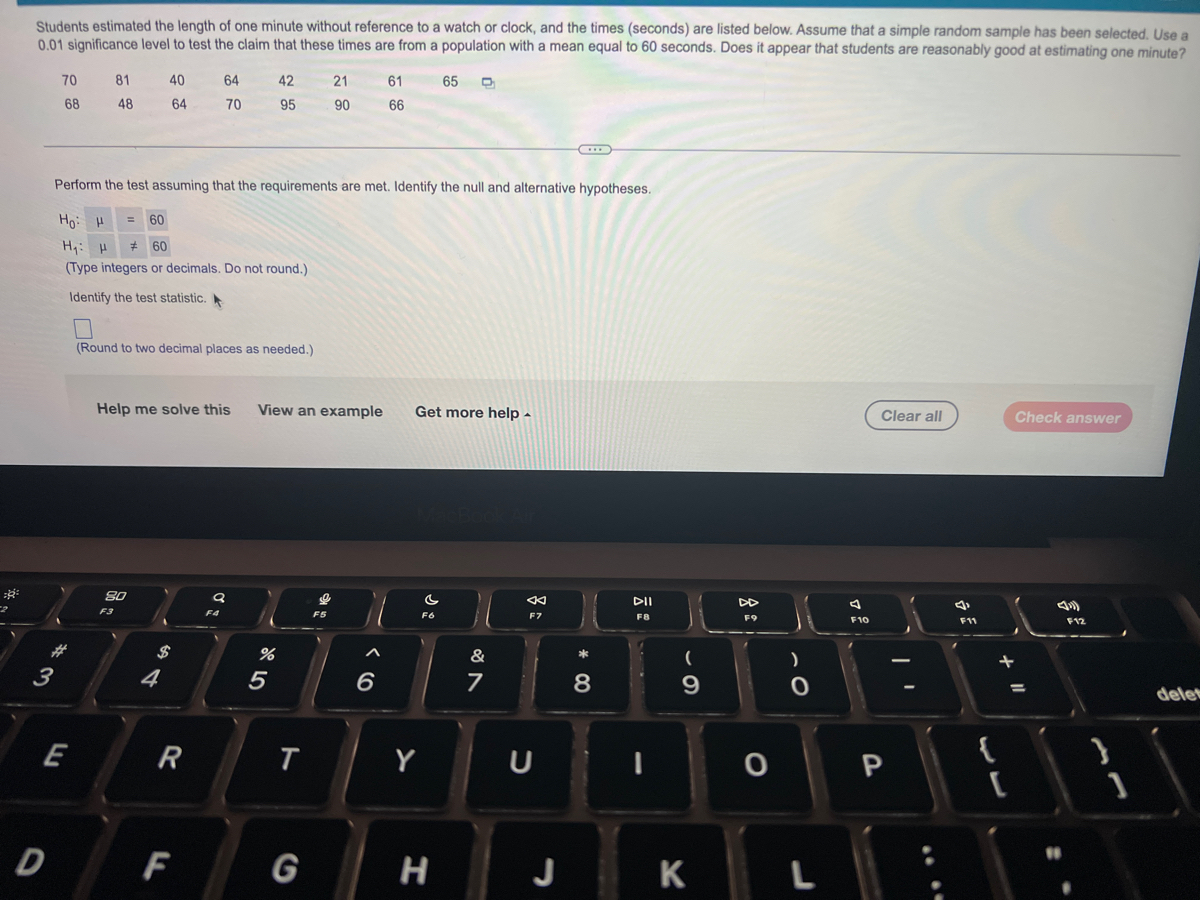

Transcribed Image Text:Students estimated the length of one minute without reference to a watch or clock, and the times (seconds) are listed below. Assume that a simple random sample has been selected. Use a
0.01 significance level to test the claim that these times are from a population with a mean equal to 60 seconds. Does it appear that students are reasonably good at estimating one minute?
70
81
40
64
42
21
61
65
68
48
64
70
95
90
66
Perform the test assuming that the requirements are met. Identify the null and alternative hypotheses.
Ho: H
= 60
Hy: H
* 60
(Type integers or decimals. Do not round.)
Identify the test statistic.
(Round to two decimal places as needed.)
Help me solve this
View an example
Get more help -
Clear all
Check answer
80
DII
F3
F5
F6
F7
FB
F9
F10
F11
F12
$
&
3
4
6
7
%3D
delet
E
R
Y
{
D
F
G
J
K
Expert Solution
This question has been solved!
Explore an expertly crafted, step-by-step solution for a thorough understanding of key concepts.

This is a popular solution

Trending nowThis is a popular solution!

Step by stepSolved in 4 steps with 1 images

Knowledge Booster

Similar questions
- Describe the significance of null hypothesis.arrow_forwardAccording to the Pew Research Center, 14% of adults rate basketball as their favorite sport. Your boss believes the proportion may be lower among adults over age 65, and wants you to collect evidence to see if this is true. What are the null and alternative hypotheses? Group of answer choices attached in ssarrow_forwardA recent Food and Drug Administration (FDA) report states that 65% of all domestically produced food products are pesticide free. Suppose an FDA spokesperson believes that less than 65% of all foreign produced food products are pesticide free. Specify the null and alternative hypotheses that would be used to test the spokesperson’s beliefarrow_forward
- A researcher selects a sample of international students and provides them with extra support to pursue their educational goals. The graduation rates for the sample is compared to the graduation rates for international students overall. In this study design, what are the null and alternative hypotheses? answer should be in the form of 2 complete sentences.arrow_forwardA researcher believes that more than half of college students average less than 6 hours of sleep per night during the week. Suppose she collected data to test her belief and found a p-value < 0.0001. Fill in the information for her hypothesis test below. Type of test: a. Left-tail b. Right-tail c. Two-tailarrow_forwardYou may need to use the appropriate appendix table or technology to answer this question. In 2012, seventy percent of Canadian households had an internet connection. A sample of 370 households taken in 2013 showed that 76% of them had an internet connection. We are interested in determining whether or not there has been a significant increase in the percentage of the Canadian households that have internet connections. (a) State the null and alternative hypotheses to be tested. (Enter != for as needed. Let p be the proportion of all Canadian households with internet connections.) Ho: на: (b) Compute the test statistic. (Round your answer to two decimal places.) (c) The null hypothesis is to be tested at the 5% level of significance. Determine the critical value(s) for this test. (Round your answer(s) to two decimal places. If the test is one-tailed, enter NONE for the unused tail.) test statistic (d) What do you conclude? Do not reject Ho. We can conclude that there has been a…arrow_forward
- Calculate the test statistic for the test of hypothesesarrow_forwardStudies done by the CDC have found that about 35.2% of all American adults do not get enough sleep (<7 hours) in 2014. Researchers feel that this percent is higher for men (age 18-24). From a sample of 200 men, 88 indicated that they get less than 7 hours of sleep. Test the researchers' hypothesis that the percent is higher than 35.2%. Write down the null and alternative hypotheses. b. Calculate the test statistic. Mr C. Calculate the p-value. d. Based on the p-value, what is your conclusion? a.arrow_forward1. Define the critical region for a hypothesis test and explain how we use it to support or reject our null and alternative hypotheses. 2. Identify and explain the influence of the three factors that affect the value of the z-score in a hypothesis test. 3.Identify the steps of a hypothesis test and what additional measure should always be included. 4. Describe the difference between type I and type II errorarrow_forward
- Among a simple random sample of 331 American adults who do not have a four-year college degree and are not currently enrolled in school, 159 said they decided not to go to college because they could not afford school. A. A newspaper article states that only a minority of the American adults who decide not to go to college do so because they cannot afford it and uses the point estimate from this survey as evidence. State the null and alternative hypotheses both in symbols and in words. B. State and check the conditions for the hypothesis test.arrow_forwardLast Spring, a couple of my Oxbow students, Izzy and Hannah, studied the how long it took customers at Hannafords to get through a self-checkout line compared to waiting through the Quick Checkout (12 items or less) register. Hannafords' management claims the mean wait time for the self-checkout is less than the established mean wait time of 4.7 minutes using the Quick Checkout line. They allowed the sisters to do some data collection, perform a statistical analysis on their results and report back to them about what they found. Management is interested in increasing the number of self-checkout registers if there is evidence that the registers decrease customers wait times. They will not need as many people working register and save in payroll costs. Hannah and Izzy collected data during three 5pm - 5:30pm times on random days. The results from 40 customers had a mean wait time of 4.4 minutes with a standard deviation of 0.6 minute. Keep this information for use in the next problem.…arrow_forward
arrow_back_ios
arrow_forward_ios
Recommended textbooks for you
- MATLAB: An Introduction with ApplicationsStatisticsISBN:9781119256830Author:Amos GilatPublisher:John Wiley & Sons Inc
 Probability and Statistics for Engineering and th...StatisticsISBN:9781305251809Author:Jay L. DevorePublisher:Cengage Learning
 Statistics for The Behavioral Sciences (MindTap C...StatisticsISBN:9781305504912Author:Frederick J Gravetter, Larry B. WallnauPublisher:Cengage Learning
  Elementary Statistics: Picturing the World (7th E...StatisticsISBN:9780134683416Author:Ron Larson, Betsy FarberPublisher:PEARSON
 The Basic Practice of StatisticsStatisticsISBN:9781319042578Author:David S. Moore, William I. Notz, Michael A. FlignerPublisher:W. H. Freeman
 Introduction to the Practice of StatisticsStatisticsISBN:9781319013387Author:David S. Moore, George P. McCabe, Bruce A. CraigPublisher:W. H. Freeman
MATLAB: An Introduction with Applications
Statistics
ISBN:9781119256830
Author:Amos Gilat
Publisher:John Wiley & Sons Inc
Probability and Statistics for Engineering and th...
Statistics
ISBN:9781305251809
Author:Jay L. Devore
Publisher:Cengage Learning
Statistics for The Behavioral Sciences (MindTap C...
Statistics
ISBN:9781305504912
Author:Frederick J Gravetter, Larry B. Wallnau
Publisher:Cengage Learning
Elementary Statistics: Picturing the World (7th E...
Statistics
ISBN:9780134683416
Author:Ron Larson, Betsy Farber
Publisher:PEARSON
The Basic Practice of Statistics
Statistics
ISBN:9781319042578
Author:David S. Moore, William I. Notz, Michael A. Fligner
Publisher:W. H. Freeman
Introduction to the Practice of Statistics
Statistics
ISBN:9781319013387
Author:David S. Moore, George P. McCabe, Bruce A. Craig
Publisher:W. H. Freeman