
MATLAB: An Introduction with Applications
6th Edition
ISBN: 9781119256830
Author: Amos Gilat
Publisher: John Wiley & Sons Inc
expand_more
expand_more
format_list_bulleted
Related questions
Question
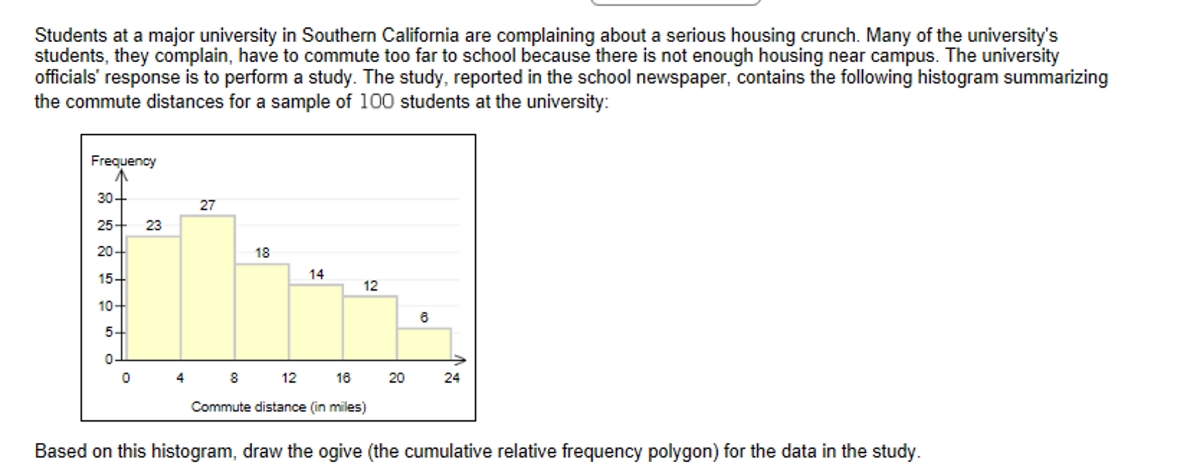

Transcribed Image Text:Students at a major university in Southern California are complaining about a serious housing crunch. Many of the university's
students, they complain, have to commute too far to school because there is not enough housing near campus. The university
officials' response is to perform a study. The study, reported in the school newspaper, contains the following histogram summarizing
the commute distances for a sample of 100 students at the university:
Frequency
30-
25-
20+
15-
10
5
0.
0
23
4
27
18
14
12
8 12 16
Commute distance (in miles)
20
6
24
Based on this histogram, draw the ogive (the cumulative relative frequency polygon) for the data in the study.
Expert Solution
This question has been solved!
Explore an expertly crafted, step-by-step solution for a thorough understanding of key concepts.

Step by stepSolved in 3 steps with 1 images

Knowledge Booster

Similar questions
- The mean birthweight of an infant is thought to be associated with the smoking status of the mother during the first trimester of the pregnancy. Consider the following data from mothers divided into four categories according to smoking habits, and the corresponding birthweights of their children. Group 1: Mother is a non smoker (NON): 7.5, 6.2, 6.9, 7.4, 9.2, 8.3, 7.6 Group 2: Mother is an ex-smoker (EX): 5.8, 7.3, 8.2, 7.1, 7.8 Group 3: Mother is a current smoker, smokes less than 1 pack per day (CUR < 1) 5.9, 6.2, 5.8, 4.7, 8.3, 7.2, 6.2 Group 4: Mother is a current smoker, smokes more than or equal to 1 pack per day (Cur ≥ 1) 6.2, 6.8, 5.7, 4.9, 6.2, 7.1, 5.8, 5.4 Using Stata test whether or not the mean birthweights are equal across all four groups at the alpha = 0.05 level. What is the corresponding p-value? O 0.0284 0.0137 O 0.05 O 0.737arrow_forwardYou may need to use the appropriate technology to answer this question. The Wall Street Journal Corporate Perceptions Study 2011 surveyed readers and asked how each rated the quality of management and the reputation of the company for over 250 worldwide corporations. Both the quality of management and the reputation of the company were rated on an excellent, good, and fair categorical scale. Assume the sample data for 200 respondents below applies to this study. Reputation of Company Quality of Management Excellent Good Fair Excellent 40 25 8 Good 35 35 10 Fair 25 10 12 (a) Use a 0.05 level of significance and test for independence of the quality of management and the reputation of the company. State the null and alternative hypotheses. O H: Quality of management is independent of the reputation of the company. H: Quality of management is not independent of the reputation of the company. O H: Quality of management is independent of the reputation of the H: The proportion of companies…arrow_forward. In an upcoming decision to relocate, a new graduate’s decision on location choice comes down to housing prices. The following data are the monthly rental prices for a sample of unfurnished studio apartments in Concord, New Hampshire, and a sample of unfurnished studio apartments in Charleston, West Virginia: Concord$955 $980 $940 $975 $965 $990 $1,240 $1,120Charleston$725 $705 $695 $725 $690 $745 $575 $800a. For each set of data, compute the mean, median, mode, range, standard deviation, and coefficient of variation. b. What conclusions can you draw about unfurnished studio apartments renting in Concord versus Charleston? Compare and contrast.arrow_forward
- Health insurer benefits vary by the size of the company. The sample data below show the number of companies providing health insurance for small, medium, and large companies. For the purpose of this study, small companies are companies that have fewer than 100 employees. Medium-sized companies have 100 to 999 employees, and largevcompanies have 1000 or more employees. The questionnaire sent to 225 employees asked whether or not the employee had health insurance and then asked the employee to indicate the size of the company. Health Insurance Size of company Yes No Total Small. 35 15 50 Medium 67 8 75 Large 87 13 100 A. Conduct a test of independence to determine whether health insurance coverage is independent of the size of the company. What is the p-value? Compute the value of the x2 test statistic (to 2 decimal)arrow_forwardThe Bureau of Labor Statistics reports that the official unemployment rate for Black people was 10.4% and 4.7% for White people in February 2015. Select all correct answers for this question. O The samples of white and black people are independent. The explanatory variable is the unemployment rate. The response variable is the unemployment rate. The response variable is race.arrow_forwardKindly assist with creating bar charts, or pie charts for the below results; The results of this study were based on interviews issued and completed by eleven (11) employees at the Hotel. This research study comprised 31.4% of the total workforce across the three departments, with a total of 35 employees who varied in age from 16 years to above 65 years. 63.6% of individuals who participated were female, while 36% were male. The interviews included participation from 30% of employees in the housekeeping department, 33% from Guest Services, and 31% from the Food and Beverage department. There is a higher representation of females across all departments, with a total of 7 females compared to 4 males. There is a range of tenure lengths, with some employees having just started (1 year) and others having been with the hotel for longer periods (up to 14.5 years).arrow_forward
- A researcher is interested in exploring the relationship between calcium intake and weight loss. Two different groups, each with 2626 dieters, are chosen for the study. Group A is required to follow a specific diet and exercise regimen, and also take a 500-mg supplement of calcium each day. Group B is required to follow the same diet and exercise regimen, but with no supplemental calcium. After six months on the program, the members of Group A had lost a mean of 10.4 pounds with a standard deviation of 2.6 pounds. The members of Group B had lost a mean of 11.7pounds with a standard deviation of 2.8 pounds during the same time period. Assume that the population variances are not the same. Construct a 99% confidence interval to estimate the true difference between the mean amounts of weight lost by dieters who supplement with calcium and those who do not. Let Population 1 be the amount of weight lost by Group A, who took a 500-mg supplement of calcium each day, and let Population 2 be…arrow_forwardYour statistics instructor often ponders the relationship between commute time and job satisfaction while driving back and forth to campus. Your instructor hypothesizes that people with a shorter commute time will have higher degrees of job satisfaction. Randomly sampling 600 Valley commuters, the instructor finds the following data listed in frequencies: Table 2: Commuters by Length of Commute and Job Satisfaction Job Satisfaction Number Who Commute 20 Minutes or Less Number Who Commute 21 to 40 Minutes Number Who Commute 41 Minutes or More Total Number for Each Level of Job Satisfaction Dissatisfied 10 60 140 210 Neutral 45 59 51 155 Satisfied 145 60 30 235 Total Number for Each Commute Time Range 200 179 221 1. Change frequencies to column percentages.arrow_forwardBank of America's Consumer Spending Survey collected data on annual credit card charges in seven different categories of expenditures: transportation, groceries, dining out, household expenses, home furnishings, apparel, and entertainment. Using data from a sample of 42 credit card accounts, assume that each account was used to identify the annual credit card charges for groceries (population 1) and the annual credit card charges for dining out (population 2) Using the difference data, the sample mean difference was d = $850, and the sample standard deviation was så = $1,123. a. Formulate the null and alternative hypotheses to test for no difference between the population mean credit card charges for groceries and the population mean credit card charges for dining out. Ho : μα ♦ Select your answer - Ha d + - Select your answer - b. Use a = = 0.05 level of significance. Can you conclude that the population means differ? - Select your answer - ◆ What is the p-value? (to 6 decimals) c.…arrow_forward
- I need help with 7, 8 and 9arrow_forwardIn a study of computer use, 1000 randomly selected Canadian Internet users were asked how much time they spend using the Internet in a typical week. The mean of the sample observations was 12.6 hours.arrow_forwardA survey collected data on annual credit card charges in seven different categories of expenditures: transportation, groceries, dining out, household expenses, home furnishings, apparel, and entertainment. Using data from a sample of 42 credit card accounts, assume that each account was used to identify the annual credit card charges for groceries (population 1) and the annual credit card charges for dining out (population 2). Using the difference data, with population 1– population 2, the sample mean difference was d = $870, and the sample standard deviation was s,= $1,125. (a) Formulate the null and alternative hype to test for no difference between the population mean credit card charges for groceries and the population mean credit card charges for dining out. 0> Prt :°H 0 = Pri :ºH O O Ho: Hdso H: H=0 (b) Calculate the test statistic. (Round your answer to three decimal places.) What is the p-value? (Round your answer to four decimal places.) Can you conclude that the population…arrow_forward
arrow_back_ios
SEE MORE QUESTIONS
arrow_forward_ios
Recommended textbooks for you
- MATLAB: An Introduction with ApplicationsStatisticsISBN:9781119256830Author:Amos GilatPublisher:John Wiley & Sons Inc
 Probability and Statistics for Engineering and th...StatisticsISBN:9781305251809Author:Jay L. DevorePublisher:Cengage Learning
 Statistics for The Behavioral Sciences (MindTap C...StatisticsISBN:9781305504912Author:Frederick J Gravetter, Larry B. WallnauPublisher:Cengage Learning
  Elementary Statistics: Picturing the World (7th E...StatisticsISBN:9780134683416Author:Ron Larson, Betsy FarberPublisher:PEARSON
 The Basic Practice of StatisticsStatisticsISBN:9781319042578Author:David S. Moore, William I. Notz, Michael A. FlignerPublisher:W. H. Freeman
 Introduction to the Practice of StatisticsStatisticsISBN:9781319013387Author:David S. Moore, George P. McCabe, Bruce A. CraigPublisher:W. H. Freeman
MATLAB: An Introduction with Applications
Statistics
ISBN:9781119256830
Author:Amos Gilat
Publisher:John Wiley & Sons Inc
Probability and Statistics for Engineering and th...
Statistics
ISBN:9781305251809
Author:Jay L. Devore
Publisher:Cengage Learning
Statistics for The Behavioral Sciences (MindTap C...
Statistics
ISBN:9781305504912
Author:Frederick J Gravetter, Larry B. Wallnau
Publisher:Cengage Learning
Elementary Statistics: Picturing the World (7th E...
Statistics
ISBN:9780134683416
Author:Ron Larson, Betsy Farber
Publisher:PEARSON
The Basic Practice of Statistics
Statistics
ISBN:9781319042578
Author:David S. Moore, William I. Notz, Michael A. Fligner
Publisher:W. H. Freeman
Introduction to the Practice of Statistics
Statistics
ISBN:9781319013387
Author:David S. Moore, George P. McCabe, Bruce A. Craig
Publisher:W. H. Freeman