
MATLAB: An Introduction with Applications
6th Edition
ISBN: 9781119256830
Author: Amos Gilat
Publisher: John Wiley & Sons Inc
expand_more
expand_more
format_list_bulleted
Related questions
Question
thumb_up100%
It-84 please
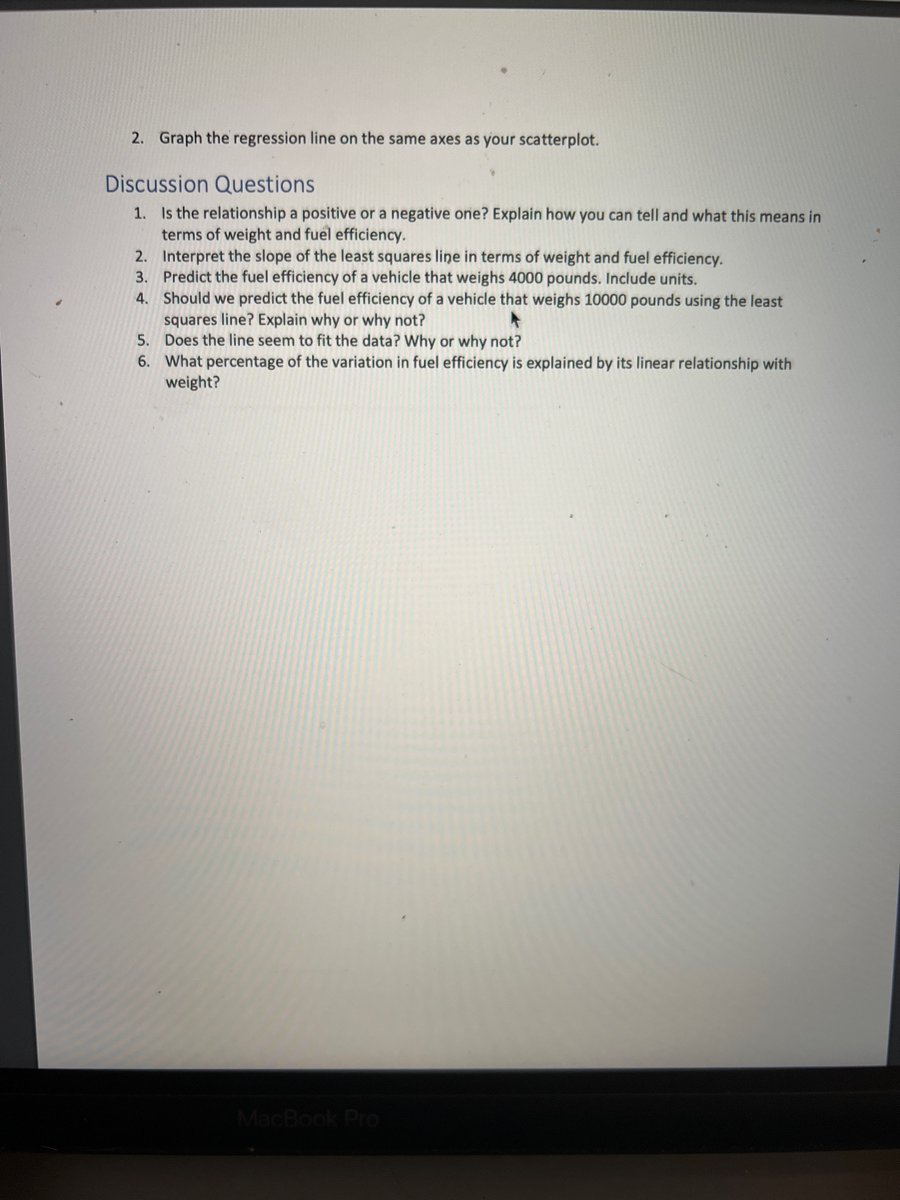

Transcribed Image Text:2. Graph the regression line on the same axes as your scatterplot.
Discussion Questions
1. Is the relationship a positive or a negative one? Explain how you can tell and what this means in
terms of weight and fuel efficiency.
2. Interpret the slope of the least squares line in terms of weight and fuel efficiency.
3. Predict the fuel efficiency of a vehicle that weighs 4000 pounds. Include units.
4.
Should we predict the fuel efficiency of a vehicle that weighs 10000 pounds using the least
squares line? Explain why or why not?
A
5.
Does the line seem to fit the data? Why or why not?
6. What percentage of the variation in fuel efficiency is explained by its linear relationship with
weight?
MacBook Pro

Transcribed Image Text:Student Learning Outcomes
• Calculate and construct the line of best fit between two variables.
Evaluate the relationship between two variables.
•
Collect the Data
1. 19 new vehicles were randomly selected. Their weight in pounds and fuel efficiency in miles per
gallon were recorded in the following table:
Weight (lbs) Fuel Efficiency (mpg)
2620
21.0
2875
21.0
2320
22.8
3215
21.4
3440
18.7
3460
18.1
3570
14.3
3190
24.4
3150
3440
3440
4070
3730
3780
5250
5424
5345
2200
1615
Table 12.11
22.8
19.2
17.8
16.4
17.3
15.2
10.4
10.4
14.7
32.4
33.9
2. Which variable should be the dependent variable, and which should be the independent
variable? Why?
3. Construct a scatterplot of weight versus fuel efficiency. Plot the points. Label and scale the axes.
iciency)
Analyze the Data
Enter the data into your calculator. Write the linear equation, rounding to 4 decimal places.
1. Calculate the following:
a. a=
b. b =
C. r =
d. n =
e. 9 =
MacBook Pro
G Search or type URL
J
Expert Solution
This question has been solved!
Explore an expertly crafted, step-by-step solution for a thorough understanding of key concepts.

Step by stepSolved in 2 steps with 3 images

Knowledge Booster

Similar questions
Recommended textbooks for you
- MATLAB: An Introduction with ApplicationsStatisticsISBN:9781119256830Author:Amos GilatPublisher:John Wiley & Sons Inc
 Probability and Statistics for Engineering and th...StatisticsISBN:9781305251809Author:Jay L. DevorePublisher:Cengage Learning
 Statistics for The Behavioral Sciences (MindTap C...StatisticsISBN:9781305504912Author:Frederick J Gravetter, Larry B. WallnauPublisher:Cengage Learning
  Elementary Statistics: Picturing the World (7th E...StatisticsISBN:9780134683416Author:Ron Larson, Betsy FarberPublisher:PEARSON
 The Basic Practice of StatisticsStatisticsISBN:9781319042578Author:David S. Moore, William I. Notz, Michael A. FlignerPublisher:W. H. Freeman
 Introduction to the Practice of StatisticsStatisticsISBN:9781319013387Author:David S. Moore, George P. McCabe, Bruce A. CraigPublisher:W. H. Freeman
MATLAB: An Introduction with Applications
Statistics
ISBN:9781119256830
Author:Amos Gilat
Publisher:John Wiley & Sons Inc
Probability and Statistics for Engineering and th...
Statistics
ISBN:9781305251809
Author:Jay L. Devore
Publisher:Cengage Learning
Statistics for The Behavioral Sciences (MindTap C...
Statistics
ISBN:9781305504912
Author:Frederick J Gravetter, Larry B. Wallnau
Publisher:Cengage Learning
Elementary Statistics: Picturing the World (7th E...
Statistics
ISBN:9780134683416
Author:Ron Larson, Betsy Farber
Publisher:PEARSON
The Basic Practice of Statistics
Statistics
ISBN:9781319042578
Author:David S. Moore, William I. Notz, Michael A. Fligner
Publisher:W. H. Freeman
Introduction to the Practice of Statistics
Statistics
ISBN:9781319013387
Author:David S. Moore, George P. McCabe, Bruce A. Craig
Publisher:W. H. Freeman