MATLAB: An Introduction with Applications
6th Edition
ISBN: 9781119256830
Author: Amos Gilat
Publisher: John Wiley & Sons Inc
expand_more
expand_more
format_list_bulleted
Question

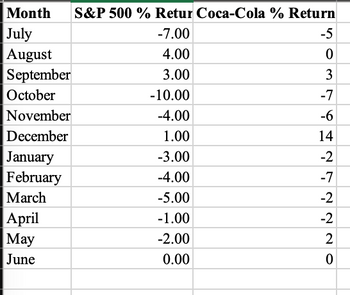
Transcribed Image Text:Month
July
August
September
October
November
December
January
February
March
April
May
June
S&P 500 % Retur Coca-Cola % Return
-7.00
4.00
3.00
-10.00
-4.00
1.00
-3.00
-4.00
-5.00
-1.00
-2.00
0.00
-5
0
3
-7
-6
14
-2
-7
222
-2
-2
0

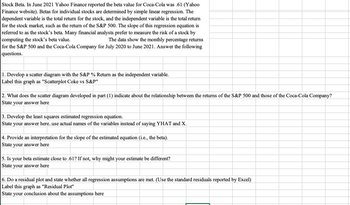
Transcribed Image Text:Stock Beta. In June 2021 Yahoo Finance reported the beta value for Coca-Cola was .61 (Yahoo
Finance website). Betas for individual stocks are determined by simple linear regression. The
dependent variable is the total return for the stock, and the independent variable is the total return
for the stock market, such as the return of the S&P 500. The slope of this regression equation is
referred to as the stock's beta. Many financial analysts prefer to measure the risk of a stock by
computing the stock's beta value.
The data show the monthly percentage returns
for the S&P 500 and the Coca-Cola Company for July 2020 to June 2021. Answer the following
questions.
1. Develop a scatter diagram with the S&P % Return as the independent variable.
Label this graph as "Scatterplot Coke vs S&P"
2. What does the scatter diagram developed in part (1) indicate about the relationship between the returns of the S&P 500 and those of the Coca-Cola Company?
State your answer here
3. Develop the least squares estimated regression equation.
State your answer here..use actual names of the variables instead of saying YHAT and X.
4. Provide an interpretation for the slope of the estimated equation (i.e., the beta).
State your answer here
5. Is your beta estimate close to .61? If not, why might your estimate be different?
State your answer here
6. Do a residual plot and state whether all regression assumptions are met. (Use the standard residuals reported by Excel)
Label this graph as "Residual Plot"
State your conclusion about the assumptions here
Expert Solution
This question has been solved!
Explore an expertly crafted, step-by-step solution for a thorough understanding of key concepts.
This is a popular solution
Trending nowThis is a popular solution!
Step by stepSolved in 4 steps with 2 images

Knowledge Booster
Similar questions
- The U.S. Postal Service is attempting to reduce the number of complaints made by the public against its workers. To facilitate this task, a staff analyst for the service regresses the number of complaints lodged against an employee last year on the hourly wage of the employee for the year. The analyst ran a simple linear regression in SPSS. The results are shown below. The current minimum wage is $5.15. If an employee earns the minimum wage, how many complaints can that employee expect to receive? Is the regression coefficient statistically significant? How can you tell?arrow_forwardWrite down the fitted regression equation. If in the family, the primary caregiver is the biological mother, whose income is $50,000 and the youth live with the family most of the time. What predicted youth absent days in school?arrow_forwardTwo variable are found to have a strong negative linear correlation. Pick the regression equation that best fits this scenario. y=0.82x−28 ˆy=0.32x−28 y= -0.82x+28 ˆy= -0.32x+28arrow_forward
- Use the Financial database from “Excel Databases.xls” on Blackboard. Use Total Revenues, Total Assets, Return on Equity, Earnings Per Share, Average Yield, and Dividends Per Share to predict the average P/E ratio for a company. Use Excel to develop the multiple linear regression model. Assume a 5% level of significance. Which independent variable is the strongest predictor of the average P/E ratio of a company? A. Total Revenues B. Average Yield C. Earnings Per Share D.Return on Equity E. Total Assets F.Dividends Per Share Company Type Total Revenues Total Assets Return on Equity Earnings per Share Average Yield Dividends per Share Average P/E Ratio AFLAC 6 7251 29454 17.1 2.08 0.9 0.22 11.5 Albertson's 4 14690 5219 21.4 2.08 1.6 0.63 19 Allstate 6 20106 80918 20.1 3.56 1 0.36 10.6 Amerada Hess 7 8340 7935 0.2 0.08 1.1 0.6 698.3 American General 6 3362 80620 7.1 2.19 3 1.4 21.2 American Stores 4 19139 8536 12.2 1.01 1.4 0.34 23.5 Amoco 7 36287…arrow_forwardFind the regression equation, letting the first variable be the predictor (x) variable. Find the best predicted Nobel Laureate rate for a country that has 78.5Internet users per 100 people. How does it compare to the country's actual Nobel Laureate rate of 1.1 per 10 million people? Internet Users Per 100 Nobel Laureates80.3 5.679.6 24.277.3 8.644.6 0.183 6.138.3 0.190.1 25.189.1 7.680.1 8.983.3 12.753.2 1.976.6 12.756.8 3.379.5 1.591.5 11.493.7 25.465.1 3.157.8 1.967.9 1.794.3 31.785.3 31.387.7 1977.7 10.8arrow_forwardDevelop a scatterplot and explore the correlation between customer age and net sales by each type of customer (regular/promotion). Use the horizontal axis for the customer age to graph. Find the linear regression line that models the data by each type of customer. Round the rate of changes (slopes) to two decimal places and interpret them in terms of the relation between the change in age and the change in net sales. What can you conclude? Hint: Rate of Change = Vertical Change / Horizontal Change = Change in y / Change in xarrow_forward
- Find the regression equation, letting the first variable be the predictor (x) variable. Find the best predicted Nobel Laureate rate for a country that has 79.4 Internet users per 100 people. How does it compare to the country's actual Nobel Laureate rate of 1.2 per 10 million people? Internet Users Per 100 Nobel Laureates 79.3 5.6 80.5 24.2 78.8 8.7 45.2 0.1 82.5 6.2 38 0.1 90.3 25.4 88.6 7.6 80.3 9.1 83.1 12.6 53.3 1.9 76.3 12.7 56.6 3.3 78.5 1.5 91.6 11.5 93.4 25.2 65.3 3.1 57.3 1.9 68.2 1.7 94.8 31.6 85.4 31.3 86.4 19.1 78.3 10.9 2) Check Imagearrow_forwardFind the equation of the regression line for the given data. Then construct a scatter plot of the data and draw the regression line. (The pair of variables have a significant correlation.) Then use the regression equation to predict the value of y for each of the given x-values, if meaningful. The table below shows the heights (in feet) and the number of stories of six notable buildings in a city. Height, x Stories, y (b) x = 649 feet (d) x = 724 feet 766 620 520 508 494 484 (a) x = 503 feet 51 46 44 43 39 38 (c) x = 318 feet Find the regression equation. (Round the slope to three decimal places as needed. Round the y-intercept to two decimal places as needed.) Choose the correct graph below. O A. O B. O C. O D. 60- 60- 60 60- 0- 800 800 800 Height (feet 800 Height (feet) Height (Teet) Stories Stories:arrow_forwardA social scientist collects information about counties in California and finds that the correlation between average income of the county and a rating of healthcare quality in the county is 0.78. A scatterplot of the two variables is football shaped. A particular county has an average income that is 0.4 SDs above the average of all counties. Using regression, we would predict that its healthcare quality is _________ SDs above the average healthcare quality for all counties, and that it is therefore at the _________ percentile of healthcare quality among all counties. Choose the answer below to fill in the two blanks. Group of answer choices 0.31; 24th 0.78; 58th 0.78; 79th 0.31; 62nd PreviousNextarrow_forward
arrow_back_ios
arrow_forward_ios
Recommended textbooks for you
 MATLAB: An Introduction with ApplicationsStatisticsISBN:9781119256830Author:Amos GilatPublisher:John Wiley & Sons Inc
 Probability and Statistics for Engineering and th...StatisticsISBN:9781305251809Author:Jay L. DevorePublisher:Cengage Learning
 Statistics for The Behavioral Sciences (MindTap C...StatisticsISBN:9781305504912Author:Frederick J Gravetter, Larry B. WallnauPublisher:Cengage Learning
 Elementary Statistics: Picturing the World (7th E...StatisticsISBN:9780134683416Author:Ron Larson, Betsy FarberPublisher:PEARSON
 The Basic Practice of StatisticsStatisticsISBN:9781319042578Author:David S. Moore, William I. Notz, Michael A. FlignerPublisher:W. H. Freeman
 Introduction to the Practice of StatisticsStatisticsISBN:9781319013387Author:David S. Moore, George P. McCabe, Bruce A. CraigPublisher:W. H. Freeman

MATLAB: An Introduction with Applications
Statistics
ISBN:9781119256830
Author:Amos Gilat
Publisher:John Wiley & Sons Inc

Probability and Statistics for Engineering and th...
Statistics
ISBN:9781305251809
Author:Jay L. Devore
Publisher:Cengage Learning

Statistics for The Behavioral Sciences (MindTap C...
Statistics
ISBN:9781305504912
Author:Frederick J Gravetter, Larry B. Wallnau
Publisher:Cengage Learning

Elementary Statistics: Picturing the World (7th E...
Statistics
ISBN:9780134683416
Author:Ron Larson, Betsy Farber
Publisher:PEARSON

The Basic Practice of Statistics
Statistics
ISBN:9781319042578
Author:David S. Moore, William I. Notz, Michael A. Fligner
Publisher:W. H. Freeman

Introduction to the Practice of Statistics
Statistics
ISBN:9781319013387
Author:David S. Moore, George P. McCabe, Bruce A. Craig
Publisher:W. H. Freeman