
MATLAB: An Introduction with Applications
6th Edition
ISBN: 9781119256830
Author: Amos Gilat
Publisher: John Wiley & Sons Inc
expand_more
expand_more
format_list_bulleted
Related questions
Concept explainers
Question

Transcribed Image Text:myopenmath.com/assess2/?čid=97456&aid%36979687#/skip/5
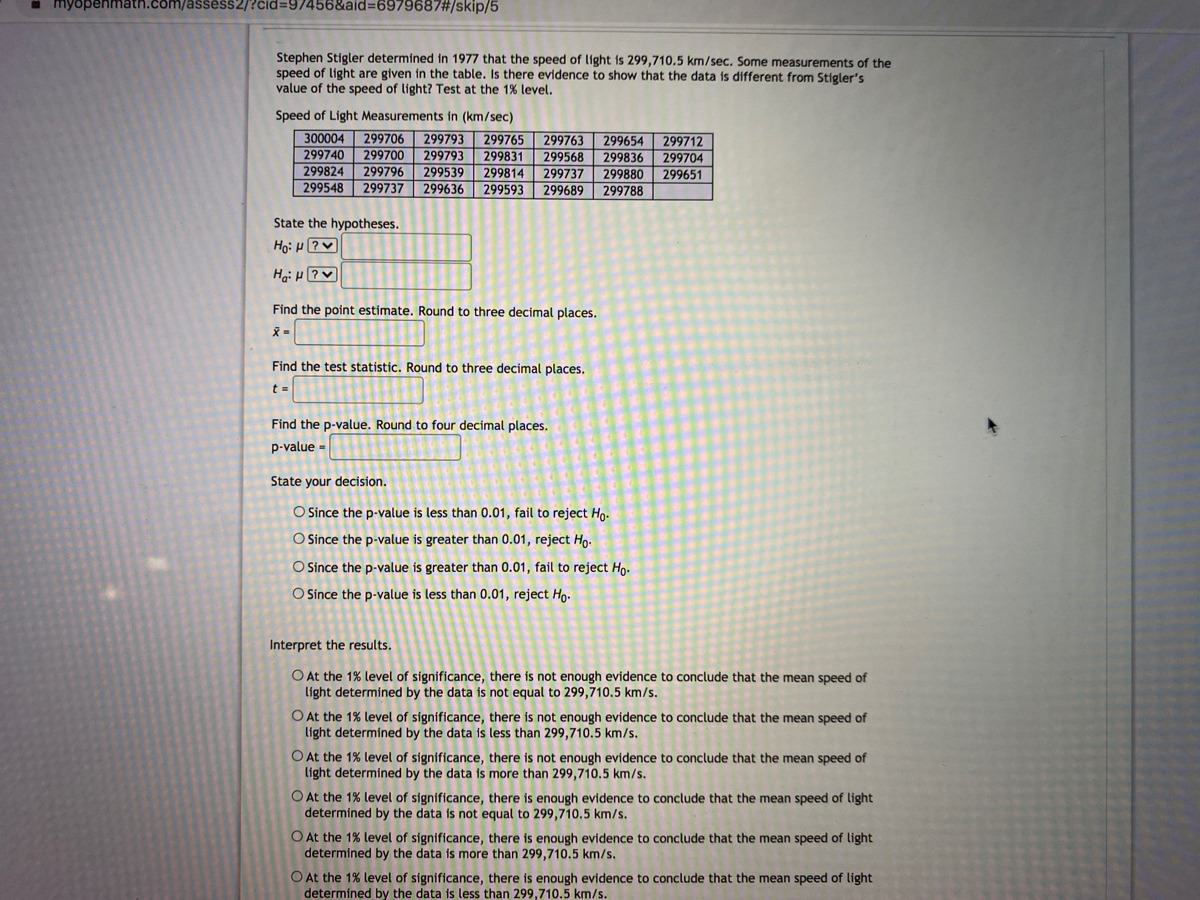
Stephen Stigler determined in 1977 that the speed of light is 299,710.5 km/sec. Some measurements of the
speed of light are given in the table. Is there evidence to show that the data
value of the speed of light? Test at the 1% level.
different from Stigler's
Speed of Light Measurements in (km/sec)
300004
299740
299824
299706
299793
299765
299831
299539 299814 299737
299593 299689
299654
299836
299880
299763
299712
299700
299793
299568
299704
299796
299651
299548
299737
299636
299788
State the hypotheses.
Find the point estimate. Round to three decimal places.
Find the test statistic. Round to three decimal places.
t =
Find the p-value. Round to four decimal places.
p-value -
State your decision.
O Since the p-value is less than 0.01, fail to reject Ho.
O Since the p-value is greater than 0.01, reject Ho-
O Since the p-value is greater than 0.01, fail to reject Ho.
O Since the p-value is less than 0.01, reject Ho.
Interpret the results.
O At the 1% level of significance, there is not enough evidence to conclude that the mean speed of
líght determined by the data is not equal to 299,710.5 km/s.
O At the 1% level of significance, there is not enough evidence to conclude that the mean speed of
light determíned by the data is less than 299,710.5 km/s.
O At the 1% level of significance, there is not enough evidence to conclude that the mean speed of
light determined by the data is more than 299,710.5 km/s.
O At the 1% level of significance, there is enough evidence to conclude that the mean speed of light
determined by the data is not equal to 299,710.5 km/s.
O At the 1% level of significance, there is enough evidence to conclude that the mean speed of light
determined by the data is more than 299,710.5 km/s.
O At the 1% level of significance, there is enough evidence to conclude that the mean speed of light
determined by the data is less than 299,710.5 km/s.
Expert Solution
This question has been solved!
Explore an expertly crafted, step-by-step solution for a thorough understanding of key concepts.

This is a popular solution

Trending nowThis is a popular solution!

Step by stepSolved in 3 steps

Knowledge Booster


Learn more about
Need a deep-dive on the concept behind this application? Look no further. Learn more about this topic, statistics and related others by exploring similar questions and additional content below.Similar questions
- With what type of data (scale of measurement) might you apply Chi Square? Describe Chi Square and give an example of when you might use the Chi Square test.arrow_forwardDo various occupational groups differ in their diets? A British study of this question compared 98 drivers and 83 conductors of London double-decker buses. The conductors' jobs require more physical activity. The article reporting the study gives the data as "Mean daily consumption (+ se)." Some of the study results appear below. Drivers Total calories 2821 +44 Alcohol (grams) 0.24 0.06 Conductors 2844 +48 0.39 ± 0.11 Construct a 99% confidence interval for the difference in mean daily alcohol consumption between drivers and conductors.arrow_forwardin the table below, what data is inputted in spss for a chi-square analysis? Irregular Seat Belt Use? Yes No Texted While Driving 1737 2048 Did not Text While Driving 1945 2775arrow_forward
- As a researcher, you are interested if there is a significant difference in immunizations in those in low socioeconomic status and those in high socioeconomic status. To evaluate this you use the data below to calculate a Chi-Square (X2). Socioeconomic Status Socioeconomic Status Total High Low Immunized 1000 500 1500 Not Immunized 250 750 1000 Total 1250 1250 2500arrow_forwardSummarize the frequency, the total dollars spent, and the mean amount spent per transaction for each type of browser. Discuss the observation you can make about heavenly chocolates business based on the type of browser?arrow_forwardRefer to the table to the right summarizing measured amounts of serum cotinine (ng/mL) from a sample of smokers. When nicotine is absorbed by the body, cotinine is produced. How many subjects are included in the summary? Is it possible to identify the exact values of all of the original cotinine measurements? Cotinine (ng/mL) 0-99 100-199 200-299 300-399 400-499 How many subjects are included in the summary? (Type a whole number.) Is it possible to identify the exact values of all of the original cotinine measurements? Frequency 10 14 15 3 2 OA. Yes. The exact data values are equally spaced numbers between the limits of each class. The number of equally spaced numbers is determined by the frequency in each class. OB. No. A frequency table only shows percentages of the sample in each category. OC. No. A frequency table only shows frequencies of data values in each category. OD. Yes. The data values are the frequencies shown in the table.arrow_forward
arrow_back_ios
arrow_forward_ios
Recommended textbooks for you
- MATLAB: An Introduction with ApplicationsStatisticsISBN:9781119256830Author:Amos GilatPublisher:John Wiley & Sons Inc
 Probability and Statistics for Engineering and th...StatisticsISBN:9781305251809Author:Jay L. DevorePublisher:Cengage Learning
 Statistics for The Behavioral Sciences (MindTap C...StatisticsISBN:9781305504912Author:Frederick J Gravetter, Larry B. WallnauPublisher:Cengage Learning
  Elementary Statistics: Picturing the World (7th E...StatisticsISBN:9780134683416Author:Ron Larson, Betsy FarberPublisher:PEARSON
 The Basic Practice of StatisticsStatisticsISBN:9781319042578Author:David S. Moore, William I. Notz, Michael A. FlignerPublisher:W. H. Freeman
 Introduction to the Practice of StatisticsStatisticsISBN:9781319013387Author:David S. Moore, George P. McCabe, Bruce A. CraigPublisher:W. H. Freeman
MATLAB: An Introduction with Applications
Statistics
ISBN:9781119256830
Author:Amos Gilat
Publisher:John Wiley & Sons Inc
Probability and Statistics for Engineering and th...
Statistics
ISBN:9781305251809
Author:Jay L. Devore
Publisher:Cengage Learning
Statistics for The Behavioral Sciences (MindTap C...
Statistics
ISBN:9781305504912
Author:Frederick J Gravetter, Larry B. Wallnau
Publisher:Cengage Learning
Elementary Statistics: Picturing the World (7th E...
Statistics
ISBN:9780134683416
Author:Ron Larson, Betsy Farber
Publisher:PEARSON
The Basic Practice of Statistics
Statistics
ISBN:9781319042578
Author:David S. Moore, William I. Notz, Michael A. Fligner
Publisher:W. H. Freeman
Introduction to the Practice of Statistics
Statistics
ISBN:9781319013387
Author:David S. Moore, George P. McCabe, Bruce A. Craig
Publisher:W. H. Freeman