
MATLAB: An Introduction with Applications
6th Edition
ISBN: 9781119256830
Author: Amos Gilat
Publisher: John Wiley & Sons Inc
expand_more
expand_more
format_list_bulleted
Related questions
Question
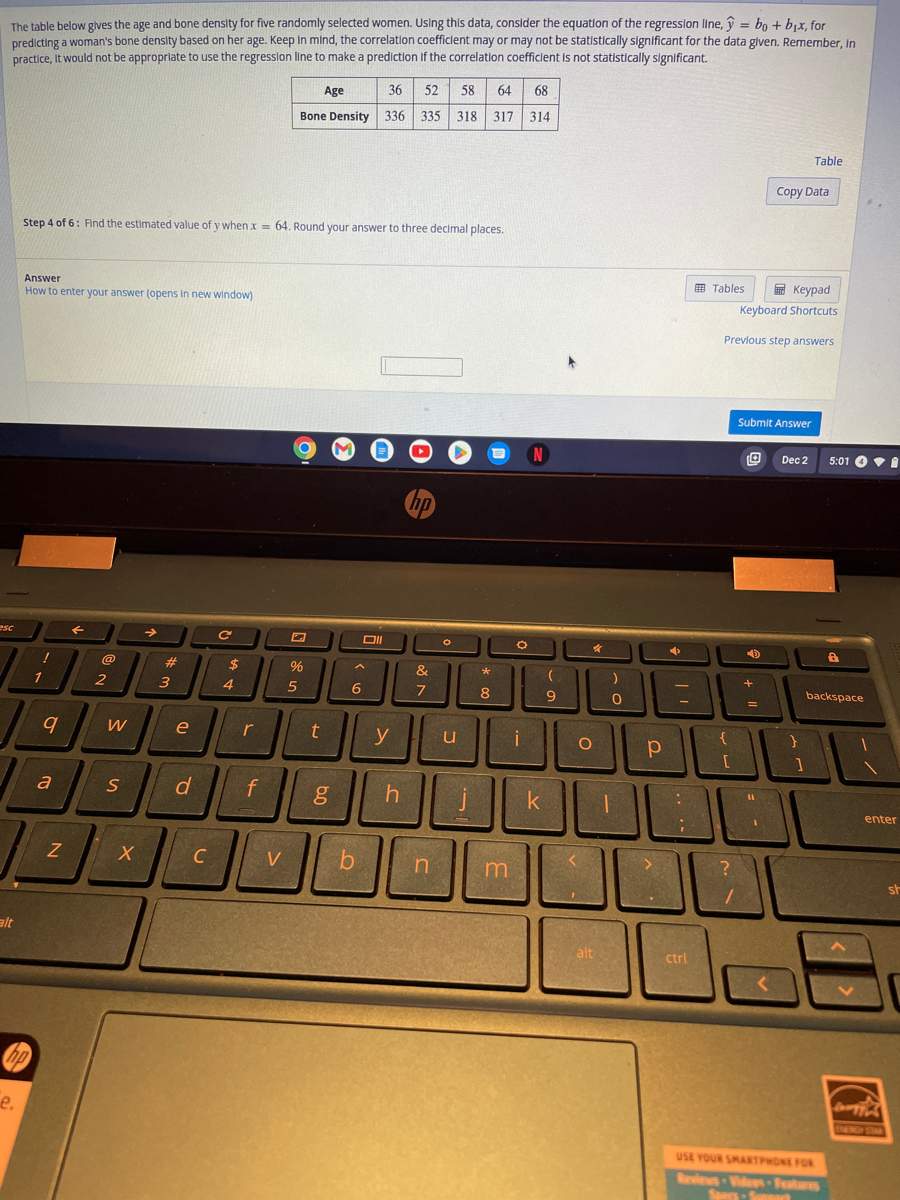

Transcribed Image Text:The table below gives the age and bone density for five randomly selected women. Using this data, consider the equation of the regression line,ŷ = bo + b₁x, for
predicting a woman's bone density based on her age. Keep in mind, the correlation coefficient may or may not be statistically significant for the data given. Remember, In
practice, It would not be appropriate to use the regression line to make a prediction if the correlation coefficient is not statistically significant.
esc
alt
e.
Step 4 of 6: Find the estimated value of y when .x = 64. Round your answer to three decimal places.
Answer
How to enter your answer (opens in new window)
hp
!
1
9
a
Z
F
2
W
S
X
→
3
#
e
d
C
C
$
4
r
f
V
Age
36 52 58 64 68
Bone Density 336 335 318 317 314
%
5
t
g
6
b
y
h
&
7
n
u
*
8
m
O
i
N
k
(
9
*
O
alt
)
0
1
CO
Р
J
>
-
-
:
;
ctrl
Tables
{
[
?
Previous step answers
Keypad
Keyboard Shortcuts
Submit Answer
4
+
=
Copy Data
11
1
Table
Dec 2
}
5:01
USE YOUR SMARTPHONE FOR
Reviews Videos Features
A
backspace
enter
sh
Expert Solution
This question has been solved!
Explore an expertly crafted, step-by-step solution for a thorough understanding of key concepts.

This is a popular solution

Trending nowThis is a popular solution!

Step by stepSolved in 2 steps with 1 images

Knowledge Booster

Similar questions
- Which two points that Ethan plotted represent numbers that have a sum of 0?Show or explain how you got your answer.arrow_forwardThe shape ofy = Va shifted right 3 units and shifted up 3 units. Previewarrow_forwardA car travels an average of 28 miles per gallon of gas. This average can vary from 6 to 10 miles per gallon, depending on how the car is driven. Choose a value from 6 to 10 that represents the miles per gallon that the mileage can vary. Write the range of miles the car could travel per gallon of gas.arrow_forward
arrow_back_ios
arrow_forward_ios
Recommended textbooks for you
- MATLAB: An Introduction with ApplicationsStatisticsISBN:9781119256830Author:Amos GilatPublisher:John Wiley & Sons Inc
 Probability and Statistics for Engineering and th...StatisticsISBN:9781305251809Author:Jay L. DevorePublisher:Cengage Learning
 Statistics for The Behavioral Sciences (MindTap C...StatisticsISBN:9781305504912Author:Frederick J Gravetter, Larry B. WallnauPublisher:Cengage Learning
  Elementary Statistics: Picturing the World (7th E...StatisticsISBN:9780134683416Author:Ron Larson, Betsy FarberPublisher:PEARSON
 The Basic Practice of StatisticsStatisticsISBN:9781319042578Author:David S. Moore, William I. Notz, Michael A. FlignerPublisher:W. H. Freeman
 Introduction to the Practice of StatisticsStatisticsISBN:9781319013387Author:David S. Moore, George P. McCabe, Bruce A. CraigPublisher:W. H. Freeman
MATLAB: An Introduction with Applications
Statistics
ISBN:9781119256830
Author:Amos Gilat
Publisher:John Wiley & Sons Inc
Probability and Statistics for Engineering and th...
Statistics
ISBN:9781305251809
Author:Jay L. Devore
Publisher:Cengage Learning
Statistics for The Behavioral Sciences (MindTap C...
Statistics
ISBN:9781305504912
Author:Frederick J Gravetter, Larry B. Wallnau
Publisher:Cengage Learning
Elementary Statistics: Picturing the World (7th E...
Statistics
ISBN:9780134683416
Author:Ron Larson, Betsy Farber
Publisher:PEARSON
The Basic Practice of Statistics
Statistics
ISBN:9781319042578
Author:David S. Moore, William I. Notz, Michael A. Fligner
Publisher:W. H. Freeman
Introduction to the Practice of Statistics
Statistics
ISBN:9781319013387
Author:David S. Moore, George P. McCabe, Bruce A. Craig
Publisher:W. H. Freeman