MATLAB: An Introduction with Applications
6th Edition
ISBN: 9781119256830
Author: Amos Gilat
Publisher: John Wiley & Sons Inc
expand_more
expand_more
format_list_bulleted
Question
Step 3.1
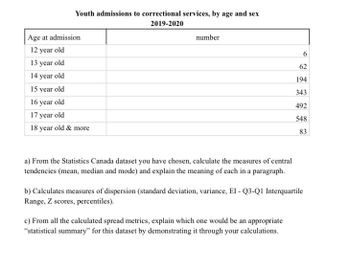
a) From the Statistics Canada dataset you have chosen, calculate the measures of central tendencies (mean , median and mode ) and explain the meaning of each in a paragraph.
b) Calculates measures of dispersion (standard deviation, variance, EI - Q3-Q1 Interquartile Range , Z scores, percentiles).
c) From all the calculated spread metrics, explain which one would be an appropriate
"statistical summary" for this dataset by demonstrating it through your calculations.

Transcribed Image Text:Youth admissions to correctional services, by age and sex
2019-2020
Age at admission
12 year old
13 year old
14 year old
15 year old
16 year old
17
year old
18 year old & more
number
a) From the Statistics Canada dataset you have chosen, calculate the measures of central
tendencies (mean, median and mode) and explain the meaning of each in a paragraph.
62
194
343
492
548
83
b) Calculates measures of dispersion (standard deviation, variance, EI - Q3-Q1 Interquartile
Range, Z scores, percentiles).
c) From all the calculated spread metrics, explain which one would be an appropriate
"statistical summary" for this dataset by demonstrating it through your calculations.
Expert Solution
This question has been solved!
Explore an expertly crafted, step-by-step solution for a thorough understanding of key concepts.
Step by stepSolved in 4 steps

Knowledge Booster
Similar questions
- The following refer to the following data set: 20 28 44 92 64 48 68 43 86 43 What is the mean (7) of this data set? mean = (Please show your answer to one decimal place.) What is the median of this data set? median = %3D What is the mode of this data set? mode = %3Darrow_forwardThe following refer to the following data set: 81.6 127.2 98.4 100.5 95.8 106.2 127.2 108 127.2 117.8 What is the arithmetic mean of this data set? mean = What is the median of this data set? median What is the mode of this data set? mode = %3Darrow_forwardDraw the box-and-whisker plot and give the five-number summary for each data set. Number of games won by the Detroit Lions in their last 10 seasons: minumim:________ (9,7,11,7,4,10,6,2,0,7) Lower Quartile:________ Median:______________ Upper Quartile:_____________ Maximum_______________arrow_forward
- Press Esc to exit full screen Class Вoys Girls Ms.Rangel 10 6. Ms.Isais 7 Mr.Gomez 8 8 Mr.Hernandez 11 5 Find: Mean Median Mode Rangearrow_forwardPlease helparrow_forwardFor the data listed below, find the following. 72, 70, 95, 91, 99, 95, 93, 80, 84 (a) the mean (b) the median (c) the upper and lower quartiles (d) the five number summary 6. (e) sketch a box-and-whiskers plot for this data **Send in photo for part e*arrow_forward
- Which of the measures of central tendency do you think you would use the most? Provide one (1) example. Explain what is meant by positive bias and negative bias in relation to the mean, mode, and median. If you were given a choice between the mean, median, or mode to calculate measures to make a decision about a set of data, which of the three measures would you use, and why?arrow_forwardDetermine the mode, median, and mean for the following data: -7,5,-4, -11, 19, -3, -5, -10,-10 Mode = Median ← - Mean Round to 2 decimal places SUBMIT QUESTION SAVE PROGRESSarrow_forwardHere is a FDT for a small data set: data freq 25 3 26 4 27 2 28 4 29 7 Find the following measures of central tendency.mean = median = mode =arrow_forward
arrow_back_ios
arrow_forward_ios
Recommended textbooks for you
 MATLAB: An Introduction with ApplicationsStatisticsISBN:9781119256830Author:Amos GilatPublisher:John Wiley & Sons Inc
 Probability and Statistics for Engineering and th...StatisticsISBN:9781305251809Author:Jay L. DevorePublisher:Cengage Learning
 Statistics for The Behavioral Sciences (MindTap C...StatisticsISBN:9781305504912Author:Frederick J Gravetter, Larry B. WallnauPublisher:Cengage Learning
 Elementary Statistics: Picturing the World (7th E...StatisticsISBN:9780134683416Author:Ron Larson, Betsy FarberPublisher:PEARSON
 The Basic Practice of StatisticsStatisticsISBN:9781319042578Author:David S. Moore, William I. Notz, Michael A. FlignerPublisher:W. H. Freeman
 Introduction to the Practice of StatisticsStatisticsISBN:9781319013387Author:David S. Moore, George P. McCabe, Bruce A. CraigPublisher:W. H. Freeman

MATLAB: An Introduction with Applications
Statistics
ISBN:9781119256830
Author:Amos Gilat
Publisher:John Wiley & Sons Inc

Probability and Statistics for Engineering and th...
Statistics
ISBN:9781305251809
Author:Jay L. Devore
Publisher:Cengage Learning

Statistics for The Behavioral Sciences (MindTap C...
Statistics
ISBN:9781305504912
Author:Frederick J Gravetter, Larry B. Wallnau
Publisher:Cengage Learning

Elementary Statistics: Picturing the World (7th E...
Statistics
ISBN:9780134683416
Author:Ron Larson, Betsy Farber
Publisher:PEARSON

The Basic Practice of Statistics
Statistics
ISBN:9781319042578
Author:David S. Moore, William I. Notz, Michael A. Fligner
Publisher:W. H. Freeman

Introduction to the Practice of Statistics
Statistics
ISBN:9781319013387
Author:David S. Moore, George P. McCabe, Bruce A. Craig
Publisher:W. H. Freeman