
MATLAB: An Introduction with Applications
6th Edition
ISBN: 9781119256830
Author: Amos Gilat
Publisher: John Wiley & Sons Inc
expand_more
expand_more
format_list_bulleted
Related questions
Question

Transcribed Image Text:Step 2
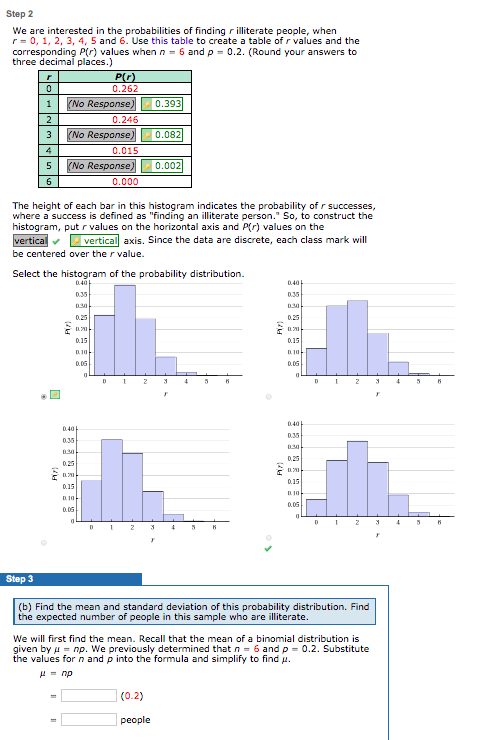
We are interested in the probabilities of finding r illiterate people, when
r = 0, 1, 2, 3, 4, 5 and 6. Use this table to create a table of r values and the
corresponding P(r) values whenn = 6 and p = 0.2. (Round your answers to
three decimal places.)
P(r)
0.262
(No Response)
0.393
2
0.246
(No Response)
0.082
0.015
(No Response)
0.002
0.000
The height of each bar in this histogram indicates the probability of r successes,
where a success is defined as "finding an illiterate person." So, to construct the
histogram, put r values on the horizontal axis and P(r) values on the
vertical
be centered over the r value.
vertical axis. Since the data are discrete, each class mark will
Select the histogram of the probability distribution.
D40
0.40
0.35
D.35
0.25
0.25
0.15
0.15
0.05
0.06
31
0.40
0.40
0.35
0.35
0.25
0.25
0.15
0.15
0.00
0.06
Step 3
(b) Find the mean and standard deviation of this probability distribution. Find
the expected number of people in this sample who are illiterate.
We will first find the mean. Recall that the mean of a binomial distribution is
given by u = np. We previously determined that n= 6 and p = 0.2. Substitute
the values for n and p into the formula and simplify to find u.
и пр
|(0.2)
people
Expert Solution
This question has been solved!
Explore an expertly crafted, step-by-step solution for a thorough understanding of key concepts.

This is a popular solution

Trending nowThis is a popular solution!

Step by stepSolved in 4 steps with 6 images

Knowledge Booster

Similar questions
- I ONLY need help with parts (c) and (d) on this Intro to probability and statistics homework problem. Below the homework problem is the answers from the textbook. Make sure your handwriting is neat and readable.arrow_forwardwhy the correct answer is letter C?arrow_forwardSuppose that you have 7 green cards and 5 yellow cards. The cards are well shuffled. You randomly draw two cards with replacement. Round your answers to four decimal places. G1 = the first card drawn is greenG2 = the second card drawn is green a. P(G1 and G2) = b. P(At least 1 green) = c. P(G2|G1) =arrow_forward
- Find the value of each by hand. Do not use statistical features of your calculator. (a) 8! (b) 13C10arrow_forward(c-1) Comparison of credits at time of graduation for randomly chosen accounting and economics students: x⎯⎯1x¯1 = 149, s1 = 2.8, n1 = 12, x⎯⎯2x¯2 = 146, s2 = 2.7, n2 = 17, α = .05, right-tailed test.(Negative values should be indicated by a minus sign. Round down your d.f. answer to the nearest whole number and other answers to 4 decimal places. Do not use "quick" rules for degrees of freedom.) d.f. t-calculated p-value t-criticalarrow_forwardPart I: Probability For each of the following problems, you should write your answer as an expression. Do not give the final numeric value. For example, you should write C(4,2)/24 instead of 0.375. 5. You are playing Scrabble and you draw seven tiles: M, A, T, C, H, E, S. You line them up in some random order on your tile rack (assume all orderings are equally likely). The events M, T, and S are defined as follows: M: The tiles M, A, T, H appear consecutively. T: The tile T appears exactly in the middle (fourth position). S: The tile S is either in the first position or in the final position. Calculate the probability of each event; that is, p(M), p(T), and p(S). 5.1 5.2 What is p(MIT)? 5.3 What is p(MIS)? 5.4 5.5 What is p(T|S)? Consider all pairs of events: (M,T), (M,S), and (T,S). Which pairs of events are independent and which pairs of events are not independent? Justify your answer.arrow_forward
- A psychologist would like to examine the effects of a new drug on the activity level of animals. Three samples of rats are selected with n=5 in each sample. One group gets no drug, one group gets s small dose, and the third group gets a large dose. The psychologist records the activity level for each animal. The data from this experiment are presented below. No drug Small dose Large dose 5, 3 , 1 , 1 , 5 5, 5, 9, 6, 5 10, 12, 9, 6, 8 =3, SS=16 =6, SS=12 =9, SS=20 Do these data indicate any significant differences among the three groups? Test with α=0.05. Compute the effect size and interpret the result.arrow_forwardForeign freshmen are required to take an English placement exam. Over the past several years, 20% of the new students have failed the test and have been placed in remedial classes. In a sample of n = 100 studentsfrom this year’s class, only 12 failed the test.arrow_forwardman loves, as everyone should, to collect and analyze statistical information. He wishes to find a relationship between how many hours students study and how they do on their statistics tests. He takes a random sample of 16 students at Ideal U., asks how many hours they studied for a university-wide stat test and how they did on the test, enters the data into a computer for analysis and presents the results below. ANALYSIS OF HOURS AND GRADES (n = 16): Descriptive Statistics: HOURS GRADES Mean: 4.2 75.8 Mode: 5.0 79.0 St. Dev: 2.3 10.1 Quartiles: Q0 2.0 34.0 Q1 3.2 53.7 Q2 4.7 78.5 Q3 6.3 86.9 Q4 9.0 97.0 Regression Analysis: Reg. Eq. is: GRADE = 16.9 + 9.025*HOURS Rsquared = .985 std error = 0.027 F = 8.52 p = .018 What problem might there be in using the regression model to predict what grade a student might get if they studied 10 hours? a. The predicted grade for 10 hours is more than 100, which is impossible. b. The value of 10…arrow_forward
- Solve second onearrow_forward(2.1)arrow_forwardThe director of student recruitment is interested in the ACT scores for the incoming Freshmen class. A group of 300 students is surveyed and the research finds that these students have an average ACT score of 21. For this study, the average of 21 is an example of a(n) ___________.arrow_forward
arrow_back_ios
SEE MORE QUESTIONS
arrow_forward_ios
Recommended textbooks for you
- MATLAB: An Introduction with ApplicationsStatisticsISBN:9781119256830Author:Amos GilatPublisher:John Wiley & Sons Inc
 Probability and Statistics for Engineering and th...StatisticsISBN:9781305251809Author:Jay L. DevorePublisher:Cengage Learning
 Statistics for The Behavioral Sciences (MindTap C...StatisticsISBN:9781305504912Author:Frederick J Gravetter, Larry B. WallnauPublisher:Cengage Learning
  Elementary Statistics: Picturing the World (7th E...StatisticsISBN:9780134683416Author:Ron Larson, Betsy FarberPublisher:PEARSON
 The Basic Practice of StatisticsStatisticsISBN:9781319042578Author:David S. Moore, William I. Notz, Michael A. FlignerPublisher:W. H. Freeman
 Introduction to the Practice of StatisticsStatisticsISBN:9781319013387Author:David S. Moore, George P. McCabe, Bruce A. CraigPublisher:W. H. Freeman
MATLAB: An Introduction with Applications
Statistics
ISBN:9781119256830
Author:Amos Gilat
Publisher:John Wiley & Sons Inc
Probability and Statistics for Engineering and th...
Statistics
ISBN:9781305251809
Author:Jay L. Devore
Publisher:Cengage Learning
Statistics for The Behavioral Sciences (MindTap C...
Statistics
ISBN:9781305504912
Author:Frederick J Gravetter, Larry B. Wallnau
Publisher:Cengage Learning
Elementary Statistics: Picturing the World (7th E...
Statistics
ISBN:9780134683416
Author:Ron Larson, Betsy Farber
Publisher:PEARSON
The Basic Practice of Statistics
Statistics
ISBN:9781319042578
Author:David S. Moore, William I. Notz, Michael A. Fligner
Publisher:W. H. Freeman
Introduction to the Practice of Statistics
Statistics
ISBN:9781319013387
Author:David S. Moore, George P. McCabe, Bruce A. Craig
Publisher:W. H. Freeman