
A First Course in Probability (10th Edition)
10th Edition
ISBN: 9780134753119
Author: Sheldon Ross
Publisher: PEARSON
expand_more
expand_more
format_list_bulleted
Related questions
Question
Steele Industries has decided to use an R-Chart to monitor the changes in the variability of their 86.00 pound metal shafts. The production manager randomly samples 7 metal shafts and measures the weight of the sample (in pounds) at 18
successive time periods.
Table
Control Chart
Step 1 of 7 :
What is the Center Line of the control chart? Round your answer to three decimal places.
What is the UCL?
What is the LCL?
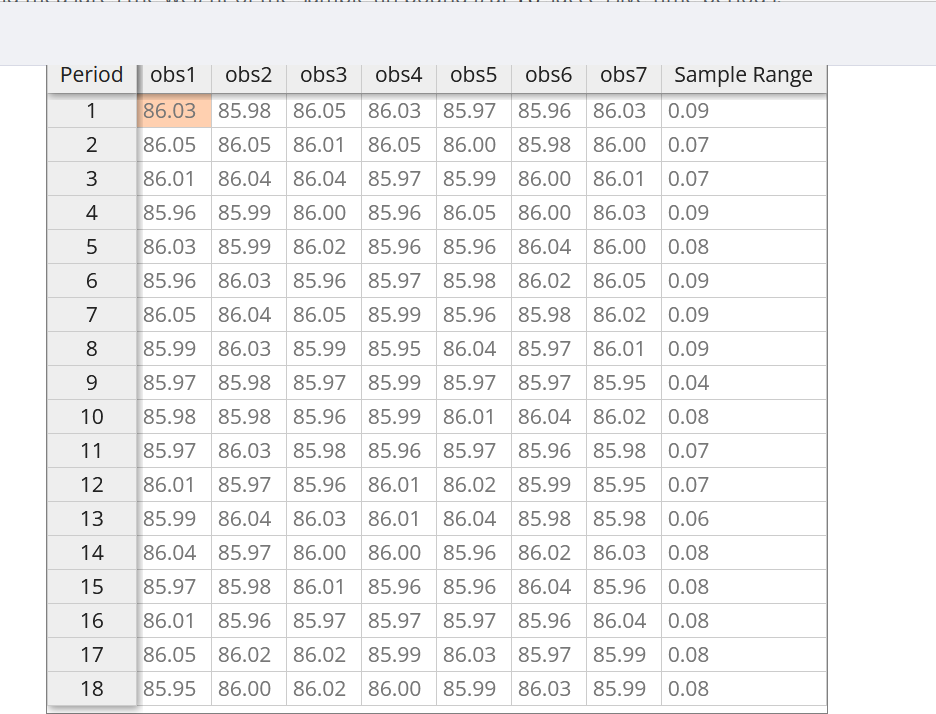

Transcribed Image Text:Period
obs1
obs2 obs3 obs4
obs5
obs6
obs7 Sample Range
1
86.03 85.98 86.05
86.03 85.97 85.96 86.03 0.09
86.05 86.05 86.01
86.05 86.00 85.98 86.00 0.07
3
86.01 86.04
86.04 85.97 85.99
86.00 86.01 0.07
4
85.96 85.99 86.00
85.96 86.05 86.00 86.03 0.09
86.03 85.99 86.02
85.96 85.96 86.04 86.00 0.08
6.
85.96 86.03 85.96
85.97 85.98 86.02 86.05 0.09
7
86.05 86.04 86.05
85.99 85.96 85.98
86.02 0.09
8
85.99 86.03
85.95 86.04 85.97 86.01 0.09
9
85.97 85.98 85.97
85.99 85.97 85.97 85.95 0.04
10
85.98 85.98 85.96
85.99 86.01 86.04 86.02 0.08
11
85.97 86.03
85.98 85.96 85.97 85.96
85.98 0.07
12
86.01 85.97 85.96
86.01
86.02 85.99 85.95 0.07
13
85.99 86.04
86.03 86.01
86.04 85.98 85.98 0.06
14
86.04 85.97 86.00
86.00 85.96 86.02 86.03 0.08
15
85.97 85.98 86.01
85.96 85.96 86.04 85.96 0.08
16
86.01 85.96 85.97
85.97 85.97 85.96 86.04 0.08
17
86.05 86.02 86.02
85.99 86.03 85.97 85.99 0.08
18
85.95 86.00 86.02
86.00 85.99 86.03 85.99 0.08

Transcribed Image Text:R-Chart
0.20
0.16
0.12
0.08
0.04
10
15
Sample Number
Sample Range
Expert Solution
This question has been solved!
Explore an expertly crafted, step-by-step solution for a thorough understanding of key concepts.

This is a popular solution

Trending nowThis is a popular solution!

Step by stepSolved in 3 steps with 3 images

Knowledge Booster

Similar questions
- Eyeglassomatic manufactures eyeglasses for different retailers. They test to see how many defective lenses they made the time period of January 1 to March 31. The table gives the defect and the number of defects. Do the data support the notion that each defect type occurs in the same proportion? Test at the 5% level. Number of Defective Lenses Defect type Number of defects Scratch 1866 Right shaped - small 1935 Flaked 1979 Wrong axis 1921 Chamfer wrong 1864 Crazing, cracks 1991 Wrong shape 2004 Wrong PD 1895 Spots and bubbles 1917 Wrong height 1885 Right shape - big 1875 Lost in lab 1886 Spots/bubble - intern 1935 State the hypotheses.H0: Each defect type in the same proportion.Ha: Each defect type in the same proportion. Calculate the χ2 test statistic. Round expected values to two decimal places. Round χ2 to three decimal places.χ2 = Calculate the p-value. Round to four decimal places.p-value = State your decision.Since p-value 0.05,…arrow_forwardUse the following cell phone airport data speeds (Mbps) from a particular network. Find the percentile corresponding to the data speed 0.9 Mbps. Percentile of 0.9 equals (Round to the nearest whole number as needed.)arrow_forwardYour assignment is to survey 10 people (friends, family, peers, etc.) and collect data for the following dependent measure:arrow_forward
- 50 part-time students were asked how many courses they were taking this term. The (incomplete) results are shown below: # of Courses Frequency Relative Frequency Cumulative Frequency 1 24 0.48 2 15 3 a. Complete the table.b. What percent of students take exactly one course? %arrow_forwardWrite the level of measurement (nominal, interval, ordinal, ratio) and type of data for each of the following: Level of Measurement Type of data: Qualitative Quantitative Discrete Quantitative Continuous Temperature (in degrees Fahrenheit) Jersey numbers of soccer players The weight of a chemical compound used in an experiment that is obtained using a well-adjusted scale An identification of police officers by rank College entrance exam scores, such as SAT scoresarrow_forwardFind the following for the data shown: 6 29 65 96 28 30 66 95 What is the percentile of the data value 66? Round to the nearest whole number. Which data value represents the 20th percentile?arrow_forward
arrow_back_ios
arrow_forward_ios
Recommended textbooks for you
- A First Course in Probability (10th Edition)ProbabilityISBN:9780134753119Author:Sheldon RossPublisher:PEARSON

A First Course in Probability (10th Edition)
Probability
ISBN:9780134753119
Author:Sheldon Ross
Publisher:PEARSON