
MATLAB: An Introduction with Applications
6th Edition
ISBN: 9781119256830
Author: Amos Gilat
Publisher: John Wiley & Sons Inc
expand_more
expand_more
format_list_bulleted
Related questions
Question
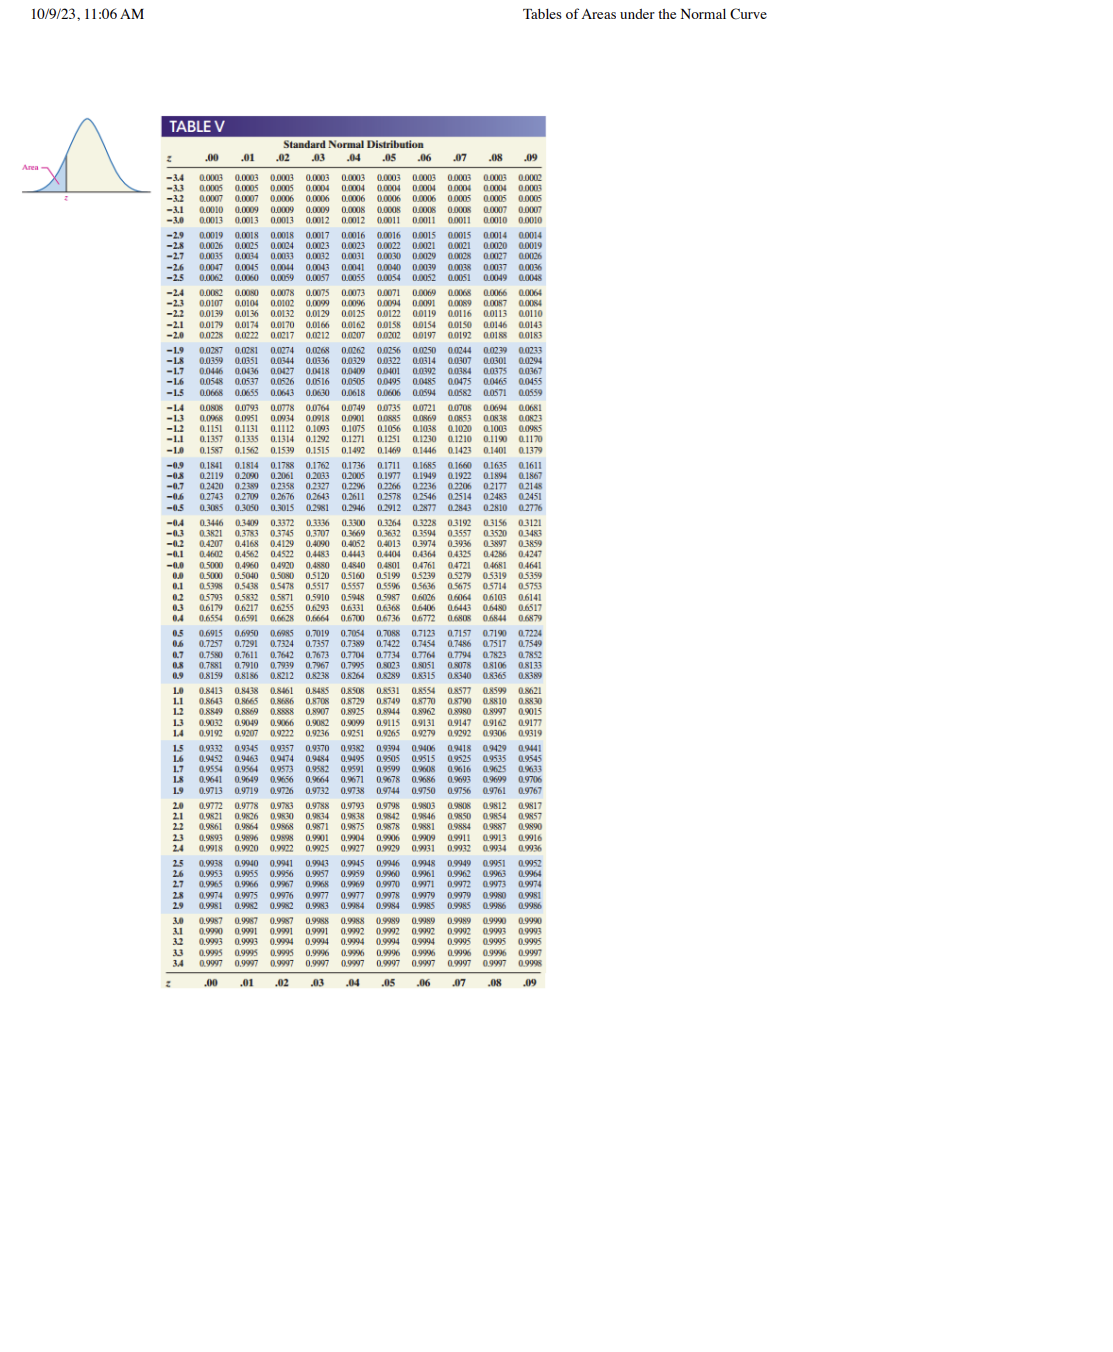

Transcribed Image Text:10/9/23, 11:06 AM
TABLE V
-2.6
-2.3
.02
.07
.08
.09
0.0019
-34 0.0003 0.0003 0.0003 0.0003 0.0003 0.0003 0.0003 0.0003 0.0003 0.0002
-33 0.0005 0.0005 0.0005 0.0004 0.0004 0.0004 0.0004 0.0004 0.0004 0.0003
-3.2 0.0007 0.0007 0.0006 0.0006 0.0006 0.0006 0.0006 0.0005 0.0005 0.0005
-3.1 0.0010 0.0009 0.0009 0.0009 0.0008 0.0008 0.0008 0.0008 0.0007 0.0007
-3.0 0.0013 0,0013 0.0013 0.0012 0.0012 0.0011 0.0011 0.0011 0.0010 0.0010
-2.9 0.0019 0.0018 0,0018 0.0017 0.0016 0.0016 0.0015 0.0015 0.0014 0.0014
-2.8 0.0026 0.0025 0.0024 0.0023 0.0023 0.0022 0.0021 0.0021 0.0020
0.0035 0.0034 0.0033 0.0032 0.0031 0.0030 0.0029 0.0028 0.0027 0.0026
0.0047 0.0045 0.0044 0.0043 0.0041 0.0040 0.0039 0.0038 0.0037 0.0036
0.0062 0.0060 0.0059 0.0057 0.0055 0.0054 0.0052 0.0051 0.0049 0.0048
-2.4 0.0082 0.0080 0.0078 0.0075 0.0073 0.0071 0.0069 0.0068 0.0066 0.0064
-2.3 0.0107 0.0104 0.0102 0.0099 0.0096 0.0094 0.0091 0.0089 0.0087 0.0084
-2.2 0.0139 0.0136 0.0132 0.0129 0.0125 00122 0.0119 0.0116 0.0113 0.0110
-2.1 0.0179 0.0174 0.0170 0.0166 0.0162 0.0158 0.0154 0.0150 0.0146 0.0143
-2.0 0.0228 0.0222 0,0217 0,0212 0.0207 0.0202 0.0197 0.0192 0.0188 0.0183
-1.9 0.0287 0,0281 0.0274 0.0268 0,0262 0.0256 0.0250 0.0244 0.0239 0.0233
-1.8 0.0359 0.0351 0.0344 0.0336 0.0329 0.0322 0.0314 0.0307 0.0301 0.0294
-1.7 0.0446 0.0436 0.0427 0.0418 0.0409 0.0401 0.0392 0.0384 0.0375 0.0367
-1.6 0.0548 0.0537 0.0526 0.0516 0,0505
-1.5 0.0668 0.0655 0.0643 0.0630 0.0618
0.0485 0.0475 0.0465 0.0455
0.0594 0.0582 0.0571 0.0559
0.1
0.2
0.3
.00
Standard Normal Distribution
03 .04 .05
-1.4 0.0808 0.0793 0.0778 0.0764 0.0749 0.0735
-1.3 0.0968 0.0951 0.0934 0,0918 0,0901 0.0885
-1.2 0.1151 0.1131 0.1112 0.1093 0.1075
-1.1
0.1357 0.1335 0.1314 0.1292 0.1271
-1.0 0.1587 0.1562 0.1539 0.1515 0,1492
-0.9 0.1841 0.1814 0.1788 0.1762 0.1736 0.1711 0.1685 0.1660 0.1635 0.1611
-0.8 0.2119 0.2090 0.2061 0.2033 0.2005 0.1977 0.1949 0.1922 0.1894 0.1867
-0.7 0.2420 0.2389 0.2358 0.2327 0.2296 0.2266 0.2236 0.2206 0.2177 02148
-0.6 0.2743 0.2709 0.2676 0.2643 0.2611 0.2578 0.2546 0.2514 02483 0.2451
-0.5 0.3085 0.3050 0.3015 0.2981 0.2946
0.2912 0.2877 0.2843 0.2810 0.2776
-0.4 0.3446 0.3409 0.3372 0.3336 0 3300 0.3264 0.3228 0.3192 0.3156 03121
-0.3
0.3783 0.3745 0.3707 0.3669 0.3632 0.3594 0.3557 0.3520 0.3483
<-0.2 0.4207 0.4168 0.4129 0.4090 04052
0.3974 0.3936 0.3897 0.3859
-0.1 0.4602 0.4562 0.4522 0.4483 0.4443 0.4404 0.4364 0.4325 0.4286 0.4247
0.5000
0,4920 0,4880 0.4840
04761 04721 0.4681 0.4641
0.5000 05040 0.5080 0.5120 0.5160 0.5199 05239
0.5279 05319 0.5359
0.5398 0.5438 0.5478 0.5517 0.5557 0.5590 0.5636 0.5675 0.571 0.5753
0.5832 0.5871 0.5910 0.5948 0.5987 0.6026 0.6064 0.6103 0.6141
06179 0.6217 06255 0.6293 06331 0.6368 0.6406 0.6443 0.6480 0.6517
0.4 0.6554 0,6591 0.6628 0.6664
0.6700 0.6736 0.6772 0.6808 0.6844 0.6879
0.6985 0,7019 0.7054
0.7123 0.7157 0.7190 0.7224
0.7324 0.7357 0.7389 0.7422 0.7454
0.7486 0.7517 0.7549
0.7 0.7580 0.7611 0.7642 0.7673 0.7704 0.7734 0.7764 0.7794 0.7823 0.7852
0.8 0.7881 0.7910 0.7939 0.7967 0.7995 0.8023 0.8051 0.8078 0.8106 0.8133
0.9 0.8159 0.8186 0.8212 0.8238 0.8264 0.8289 0.8315 0.8340 0.8365 0.8389
1.0 0.8413 0.8438 0.8461
0.8531 0.8554 0.8577 0.8599 0.8621
1.1 0.8643 0.8665 0.8686 0.8708 0.8729 0.8749 0.8770 0.8790 08810 0.8830
1.2 0.8849 0.8869 0.8888 0,8907 0.8925 0.8944 0.8962 0.8980 08997 0.9015
1.3 0.9032 0.9049 0.9066 0.9082 0.9099 0.9115 0.9131 0.9147 0.9162 0.9177
1.4 0.9192 0.9207 0.9222 0.9236 0.9251 0.9265 0.9279 0.9292 0.9306 0.9319
1.5 0.9332 0.9345 0.9357 0.9370 0,9382 0.9394 0.9406 09418 0.9429 0.9441
1.6 0.9452 0.9463 0.9474 0.9484 0.9495 0.9505 0.9515 0.9525 0.9535 0.9545
1.7 0.9554 0.9564 0.9573 0.9582 0.9591 0.9599 0.9608 0.9616 0.9625 0.9633
1.8 0,9641 0.9649 0.9656 0.9664 0.9671 0.9678 0.9686 0.9693 0.9699 0.9706
1.9 0.9713 0.9719 0.9726 0.9732 0.9738 0.9744 0.9750 0.9756 0.9761 0.9767
0.5 0.6915 0,6950
0.6 0.7257
0.8508
31
3.2
.00
90⁰
Tables of Areas under the Normal Curve
0.9890
2.0 0.9772 0.9778 0.9783 0.9788 0.9793 0.9798 0.9803 0.9808 0.9812
2.1 0.9821 0.9826 0.9830 0.9834 0.9838 0.9842 0.9846 0.9850 0.9854
22 0.9861 0.9864 0.9868 0.9871 0.9875 0.9878 0.9881 0.9884 0.9887
2.3 0.9893 0.9896 0.9898 0.9901 0.9904 0.9900 0.9909 0.9911 0.9913 0.9916
2.4 0.9918 0.9920 0.9922 0.9925 0.9927 0.9929 0.9931 0.9932 0.9934 0.9936
2.5 0.9938 0.9940 0.9941 0.9943 0.9945 0.9946 0.9948 0.9949 0.9951 0.9952
26 0.9953 0.9955 0.9956 0.9957 0.9959 0.9960 0.9961 0.9962 0.9963 0.9964
27 0.9965 0.9966 0.9967 0.9968 0.9969 0.9970 0.9971 0.9972 0.9973 0.9974
2.8 0.9974 0.9975 0.9976 0.9977 0.9977 0.9978 0.9979 0.9979 09980 0.9981
2.9 0.9981 0.9982 0.9982 0.9983 0.9984 0.9984 0.9985 0.9985 09986 0.9986
L666'0
3.0 0.9987 0.9987 0.9987 0.9988 0.9988 0.9989 0.9989 0.9989 0.9990 0.9990
0.9990 0.9991 0.9991 0.9991 0,9992 0.9992 0.9992 0.9992 0.9993 0.9993
0.9993 0.9993 0.9994 0.9994 0.9994 0.9994 0.9994 0.9995 0.9995 0.9995
3.3 0.9995 0.9995 0.9995 0.9996 0.9996 0.9996 0.9996 0.9996 0.9996 0.9997
3.4 0.9997 0.9997 0.9997
0.9997 0.9997 0.9998
0.9997 0.9997
0.9997
.01
.02
.04
.06
07
.08
.09
03
0.0721 0.0708 0.0694 0.0681
0.0869 0.0853 0.0838 0.0823
0.1038 0.1020 0.1003 0.0985
0.1251 0.1230 0.1210 0.1190 0.1170
0.1469 0.1446 0.1423 0.1401 0.1379
.05
0.9817
0.9857

Transcribed Image Text:Steel rods are manufactured with a mean length of 22 centimeter (cm). Because of variability in the manufacturing process, the lengths of the rods are approximately normally distributed with a standard deviation of 0.06 cm.
Click the icon to view a table of areas under the normal curve.
(a) What proportion of rods has a length less than 21.9 cm?
(Round to four decimal places as needed.)
Expert Solution
arrow_forward
Step 1: Information given is
Mean( )=22
)=22
standard deviation( )=0.06

Trending nowThis is a popular solution!

Step by stepSolved in 3 steps with 5 images

Follow-up Questions
Read through expert solutions to related follow-up questions below.
Follow-up Question

Transcribed Image Text:Steel rods are manufactured with a mean length of 22 centimeter (cm). Because of variability in the manufacturing process, the lengths of the rods are approximately normally distributed with a standard deviation of 0.06 cm.
Click the icon to view a table of areas under the normal curve.
(a) What proportion of rods has a length less than 21.9 cm?
0.0475 (Round to four decimal places as needed.)
(b) Any rods that are shorter than 21.86 cm or longer than 22.14 cm are discarded. What proportion of rods will be discarded?
0.0196 (Round to four decimal places as needed.)
(c) Using the results of part (b), if 5000 rods are manufactured in a day, how many should the plant manager expect to discard?
98
(Use the answer from part b to find this answer. Round to the nearest integer as needed.)
(d) If an order comes in for 10,000 steel rods, how many rods should the plant manager expect to manufacture if the order states that all rods must be between 21.9 cm and 22.1 cm?
(Round up to the nearest integer.)
Solution
by Bartleby Expert
Follow-up Question
![Steel rods are manufactured with a mean length of 22 centimeters (cm). Because of variability in the manufacturing process, the lengths of the rods are approximately normally distributed with a standard deviation of 0.06 cm.
### Questions and Solutions:
(a) **What proportion of rods has a length less than 21.9 cm?**
- Answer: 0.0475 (rounded to four decimal places).
(b) **Any rods that are shorter than 21.86 cm or longer than 22.14 cm are discarded. What proportion of rods will be discarded?**
- Answer: 0.0196 (rounded to four decimal places).
(c) **Using the results of part (b), if 5000 rods are manufactured in a day, how many should the plant manager expect to discard?**
- Answer: 98 rods (use the answer from part b and round to the nearest integer).
(d) **If an order comes in for 10,000 steel rods, how many rods should the plant manager expect to manufacture if the order states that all rods must be between 21.9 cm and 22.1 cm?**
- Solution: [Round up to the nearest integer.]
**Note:** There is an icon mentioned to view a table of areas under the normal curve, likely used to find the probabilities needed for these calculations.](https://content.bartleby.com/qna-images/question/ac3be618-b645-4bd8-855b-808ff3fc18d4/e49bfde2-bbf2-47b2-9271-ee7c0ca53f38/efhv8qq_processed.jpeg)
Transcribed Image Text:Steel rods are manufactured with a mean length of 22 centimeters (cm). Because of variability in the manufacturing process, the lengths of the rods are approximately normally distributed with a standard deviation of 0.06 cm.
### Questions and Solutions:
(a) **What proportion of rods has a length less than 21.9 cm?**
- Answer: 0.0475 (rounded to four decimal places).
(b) **Any rods that are shorter than 21.86 cm or longer than 22.14 cm are discarded. What proportion of rods will be discarded?**
- Answer: 0.0196 (rounded to four decimal places).
(c) **Using the results of part (b), if 5000 rods are manufactured in a day, how many should the plant manager expect to discard?**
- Answer: 98 rods (use the answer from part b and round to the nearest integer).
(d) **If an order comes in for 10,000 steel rods, how many rods should the plant manager expect to manufacture if the order states that all rods must be between 21.9 cm and 22.1 cm?**
- Solution: [Round up to the nearest integer.]
**Note:** There is an icon mentioned to view a table of areas under the normal curve, likely used to find the probabilities needed for these calculations.
Solution
by Bartleby Expert
Follow-up Question

Transcribed Image Text:Steel rods are manufactured with a mean length of 22 centimeter (cm). Because of variability in the
manufacturing process, the lengths of the rods are approximately normally distributed with a standard
deviation of 0.06 cm.
Click the icon to view a table of areas under the normal curve.
(a) What proportion of rods has a length less than 21.9 cm?
0.0475 (Round to four decimal places as needed.)
(b) Any rods that are shorter than 21.86 cm or longer than 22.14 cm are discarded. What proportion of rods
will be discarded?
0.0196 (Round to four decimal places as needed.)
(c) Using the results of part (b), if 5000 rods are manufactured in a day, how many should the plant
manager expect to discard?
(Use the answer from part b to find this answer. Round to the nearest integer as needed.)
Solution
by Bartleby Expert
Follow-up Question

Transcribed Image Text:Steel rods are manufactured with a mean length of 22 centimeter (cm). Because of variability in the manufacturing process, the lengths of the rods are approximately normally distributed with a standard deviation of 0.06 cm.
Click the icon to view a table of areas under the normal curve.
(a) What proportion of rods has a length less than 21.9 cm?
0.0475 (Round to four decimal places as needed.)
(b) Any rods that are shorter than 21.86 cm or longer than 22.14 cm are discarded. What proportion of rods will be discarded?
(Round to four decimal places as needed.)
Solution
by Bartleby Expert
Follow-up Questions
Read through expert solutions to related follow-up questions below.
Follow-up Question
Transcribed Image Text:Steel rods are manufactured with a mean length of 22 centimeter (cm). Because of variability in the manufacturing process, the lengths of the rods are approximately normally distributed with a standard deviation of 0.06 cm.
Click the icon to view a table of areas under the normal curve.
(a) What proportion of rods has a length less than 21.9 cm?
0.0475 (Round to four decimal places as needed.)
(b) Any rods that are shorter than 21.86 cm or longer than 22.14 cm are discarded. What proportion of rods will be discarded?
0.0196 (Round to four decimal places as needed.)
(c) Using the results of part (b), if 5000 rods are manufactured in a day, how many should the plant manager expect to discard?
98
(Use the answer from part b to find this answer. Round to the nearest integer as needed.)
(d) If an order comes in for 10,000 steel rods, how many rods should the plant manager expect to manufacture if the order states that all rods must be between 21.9 cm and 22.1 cm?
(Round up to the nearest integer.)
Solution
by Bartleby Expert
Follow-up Question
Transcribed Image Text:Steel rods are manufactured with a mean length of 22 centimeters (cm). Because of variability in the manufacturing process, the lengths of the rods are approximately normally distributed with a standard deviation of 0.06 cm.
### Questions and Solutions:
(a) **What proportion of rods has a length less than 21.9 cm?**
- Answer: 0.0475 (rounded to four decimal places).
(b) **Any rods that are shorter than 21.86 cm or longer than 22.14 cm are discarded. What proportion of rods will be discarded?**
- Answer: 0.0196 (rounded to four decimal places).
(c) **Using the results of part (b), if 5000 rods are manufactured in a day, how many should the plant manager expect to discard?**
- Answer: 98 rods (use the answer from part b and round to the nearest integer).
(d) **If an order comes in for 10,000 steel rods, how many rods should the plant manager expect to manufacture if the order states that all rods must be between 21.9 cm and 22.1 cm?**
- Solution: [Round up to the nearest integer.]
**Note:** There is an icon mentioned to view a table of areas under the normal curve, likely used to find the probabilities needed for these calculations.
Solution
by Bartleby Expert
Follow-up Question
Transcribed Image Text:Steel rods are manufactured with a mean length of 22 centimeter (cm). Because of variability in the
manufacturing process, the lengths of the rods are approximately normally distributed with a standard
deviation of 0.06 cm.
Click the icon to view a table of areas under the normal curve.
(a) What proportion of rods has a length less than 21.9 cm?
0.0475 (Round to four decimal places as needed.)
(b) Any rods that are shorter than 21.86 cm or longer than 22.14 cm are discarded. What proportion of rods
will be discarded?
0.0196 (Round to four decimal places as needed.)
(c) Using the results of part (b), if 5000 rods are manufactured in a day, how many should the plant
manager expect to discard?
(Use the answer from part b to find this answer. Round to the nearest integer as needed.)
Solution
by Bartleby Expert
Follow-up Question
Transcribed Image Text:Steel rods are manufactured with a mean length of 22 centimeter (cm). Because of variability in the manufacturing process, the lengths of the rods are approximately normally distributed with a standard deviation of 0.06 cm.
Click the icon to view a table of areas under the normal curve.
(a) What proportion of rods has a length less than 21.9 cm?
0.0475 (Round to four decimal places as needed.)
(b) Any rods that are shorter than 21.86 cm or longer than 22.14 cm are discarded. What proportion of rods will be discarded?
(Round to four decimal places as needed.)
Solution
by Bartleby Expert
Knowledge Booster

Similar questions
- See picture for parts a-c. for parts a and b: Should I use Student's t value for a and z-score for b? How do you know which to use when?arrow_forward125 OKarrow_forwardFind the area, square unit, to the nearest thousandth of the standard deviation between the given z-scores. Z equals 1.12 and z equals 1.73.arrow_forward
- Use the Empirical Rule. The mean speed of a sample of vehicles along a stretch of highway is 68 miles per hour, with a standard deviation of 3 miles per hour. Estimate the percent of vehicles whose speeds are between 65 miles per hour and 71 miles per hour. (Assume the data set has a bell-shaped distribution.) Approximately nothing% of vehicles travel between 65 miles per hour and 71 miles per hour.arrow_forwardListed in the data table are IQ scores for a random sample of subjects with medium lead levels in their blood. Also listed are statistics from a study done of IQ scores for a random sample of subjects with high lead levels. Assume that the two samples are independent simple random samples selected from normally distributed populations. Do not assume that the population standard deviations are equal. Complete parts (a) and (b) below. Click the icon to view the data table of IQ scores. a. Use a 0.05 significance level to test the claim that the mean IQ scores for subjects with medium lead levels is higher than the mean for subjects with high lead levels. What are the null and alternative hypotheses? Assume that population 1 consists of subjects with medium lead levels and population 2 consists of subjects with high lead levels. X A. Ho: H₁ H₂ H₁ H₁ H₂ c. Ho: M₁ = H₂ H₁: H₁ H₂ The test statistic is 0.56. (Round to two decimal places as needed.) The P-value is (Round to three decimal…arrow_forward
arrow_back_ios
arrow_forward_ios
Recommended textbooks for you
- MATLAB: An Introduction with ApplicationsStatisticsISBN:9781119256830Author:Amos GilatPublisher:John Wiley & Sons Inc
 Probability and Statistics for Engineering and th...StatisticsISBN:9781305251809Author:Jay L. DevorePublisher:Cengage Learning
 Statistics for The Behavioral Sciences (MindTap C...StatisticsISBN:9781305504912Author:Frederick J Gravetter, Larry B. WallnauPublisher:Cengage Learning
  Elementary Statistics: Picturing the World (7th E...StatisticsISBN:9780134683416Author:Ron Larson, Betsy FarberPublisher:PEARSON
 The Basic Practice of StatisticsStatisticsISBN:9781319042578Author:David S. Moore, William I. Notz, Michael A. FlignerPublisher:W. H. Freeman
 Introduction to the Practice of StatisticsStatisticsISBN:9781319013387Author:David S. Moore, George P. McCabe, Bruce A. CraigPublisher:W. H. Freeman
MATLAB: An Introduction with Applications
Statistics
ISBN:9781119256830
Author:Amos Gilat
Publisher:John Wiley & Sons Inc
Probability and Statistics for Engineering and th...
Statistics
ISBN:9781305251809
Author:Jay L. Devore
Publisher:Cengage Learning
Statistics for The Behavioral Sciences (MindTap C...
Statistics
ISBN:9781305504912
Author:Frederick J Gravetter, Larry B. Wallnau
Publisher:Cengage Learning
Elementary Statistics: Picturing the World (7th E...
Statistics
ISBN:9780134683416
Author:Ron Larson, Betsy Farber
Publisher:PEARSON
The Basic Practice of Statistics
Statistics
ISBN:9781319042578
Author:David S. Moore, William I. Notz, Michael A. Fligner
Publisher:W. H. Freeman
Introduction to the Practice of Statistics
Statistics
ISBN:9781319013387
Author:David S. Moore, George P. McCabe, Bruce A. Craig
Publisher:W. H. Freeman